Fig. 12
Download original image
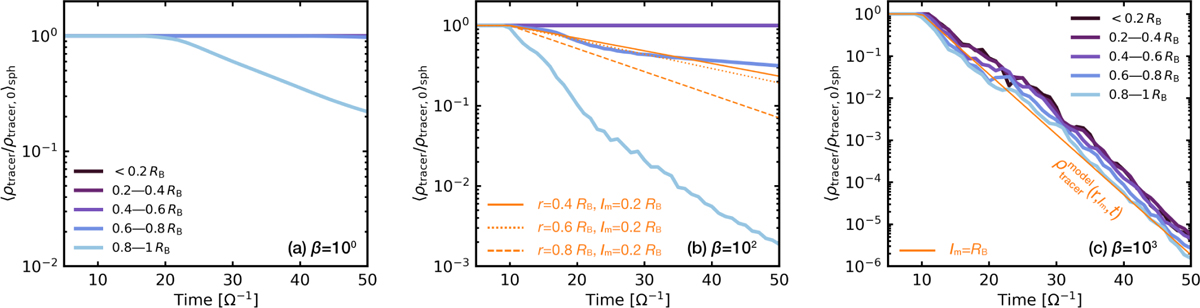
Time evolution of the shell-averaged tracer concentration for β=100 (panel a), 102 (panel b), and 103 (panel c). Different colors correspond to different shell radii. The orange lines are given by Eq. (28). In panel b we set lm=0.2 RB (partially convective) and plot the decay rate at r=0.4 RB (the solid line), r=0.6 RB (the dotted line), and r=0.8 RB (the dashed line), respectively. In panel c, we set lm=RB (fully convective).
Current usage metrics show cumulative count of Article Views (full-text article views including HTML views, PDF and ePub downloads, according to the available data) and Abstracts Views on Vision4Press platform.
Data correspond to usage on the plateform after 2015. The current usage metrics is available 48-96 hours after online publication and is updated daily on week days.
Initial download of the metrics may take a while.