Fig. 1.
Download original image
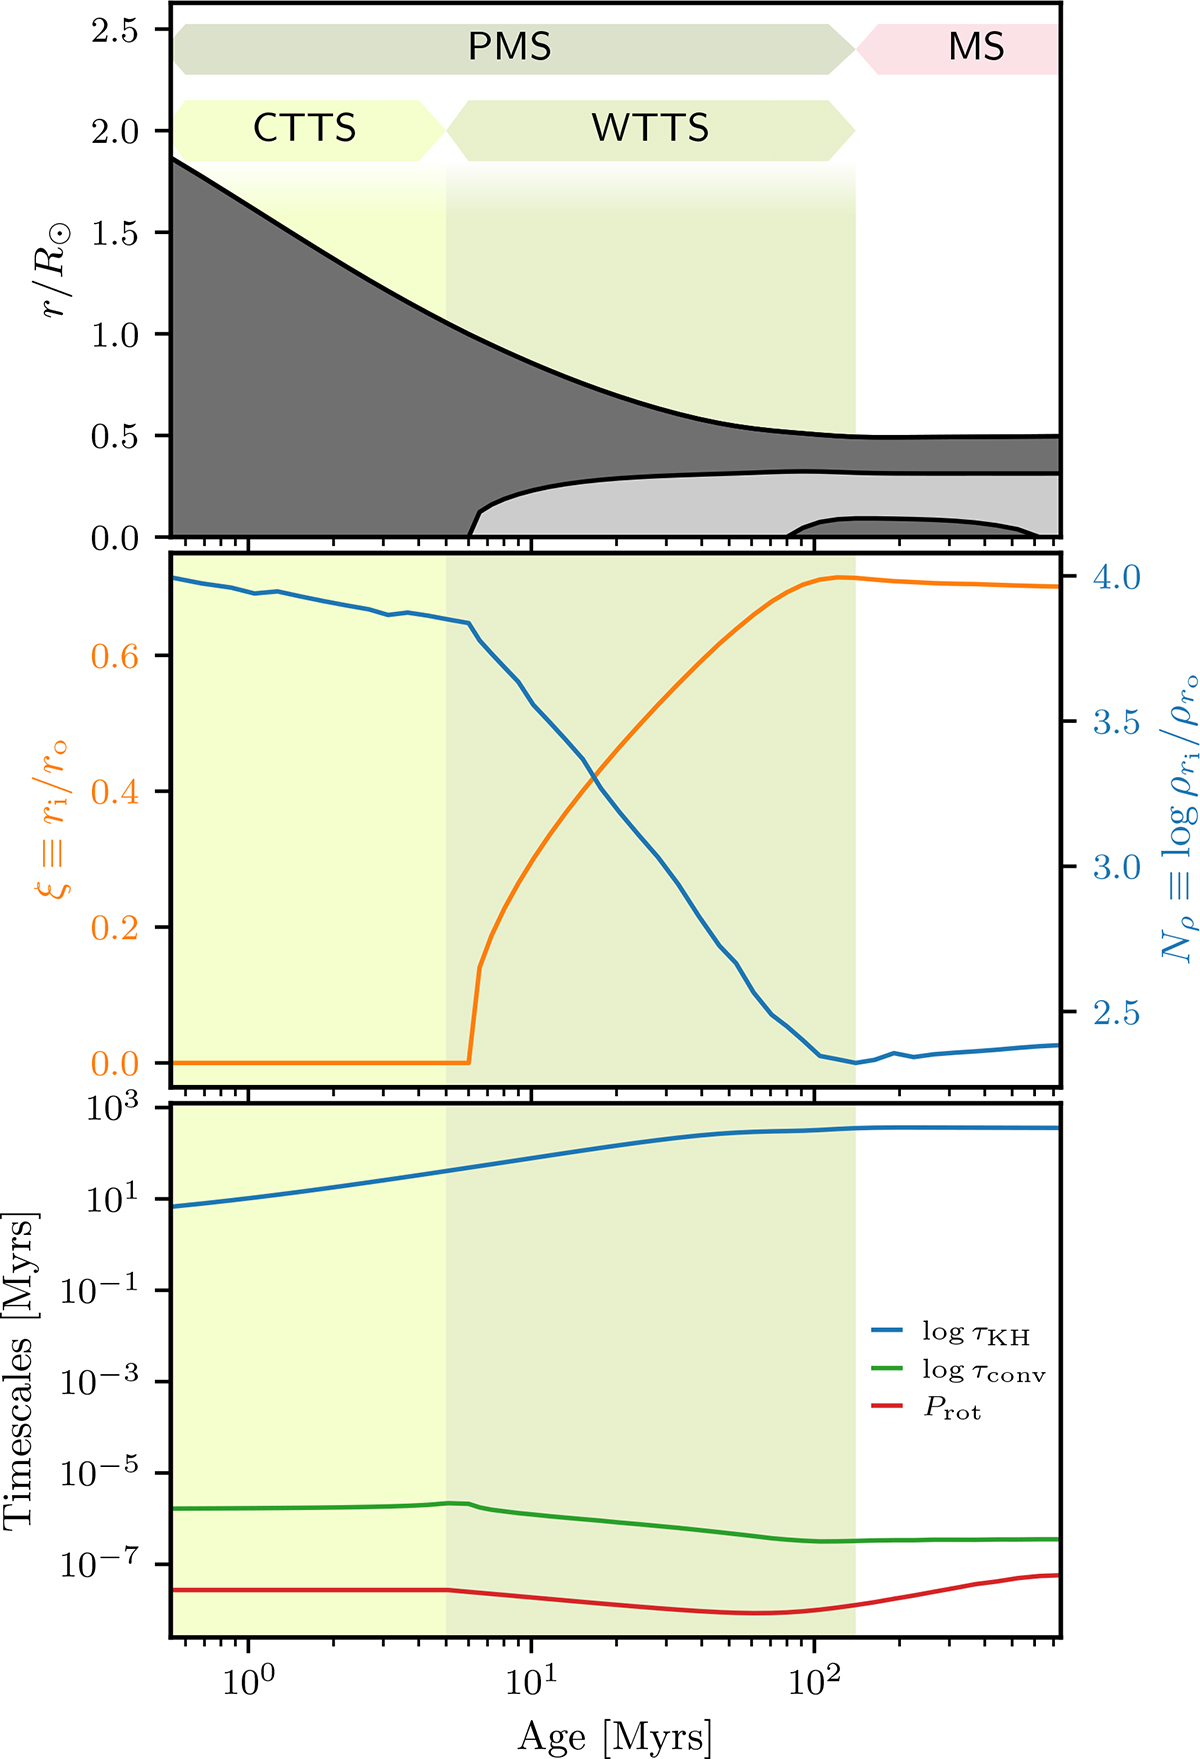
Evolution of a 0.55 M⊙ model. Top: Kippenhahn diagram. Radius of interfaces in solar unit as a function of the model’s age. Convective zones (resp. radiative zones) are represented as dark (resp. light) gray areas. Middle: Aspect ratio (left axis) and density contrast (right axis). The inner radius, ri, is the bottom radius of the convective envelope, while the outer radius, ro, is 90% of the photospheric radius. Bottom: Kelvin-Helmholtz (blue) and convection (green) timescales and surface rotation period (red). The shaded areas correspond to the classical T Tauri phase (CTTS; light green), which coincides in our case with the disk-locking phase and weak T Tauri phase (WTTS; green).
Current usage metrics show cumulative count of Article Views (full-text article views including HTML views, PDF and ePub downloads, according to the available data) and Abstracts Views on Vision4Press platform.
Data correspond to usage on the plateform after 2015. The current usage metrics is available 48-96 hours after online publication and is updated daily on week days.
Initial download of the metrics may take a while.