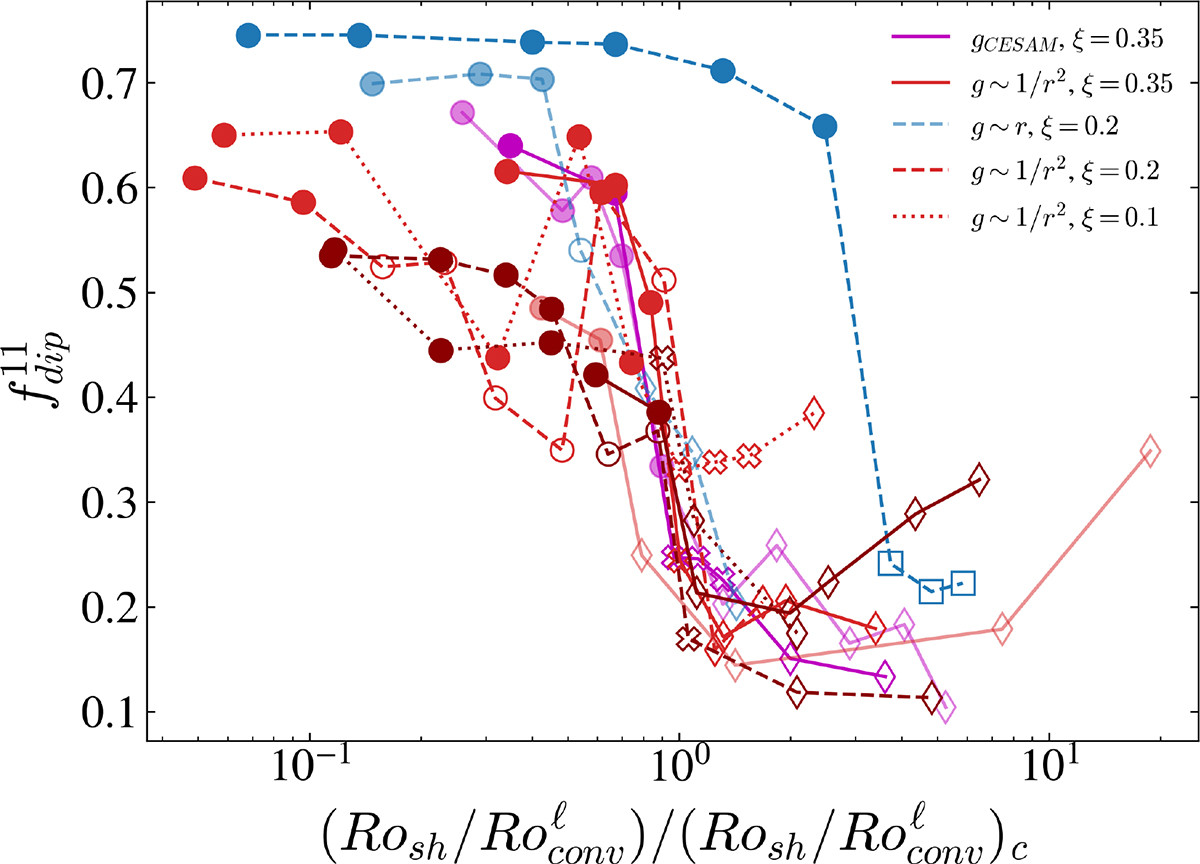
Fig. 10.
Download original image
Data for time-averaged dipolarity from all runs of this paper as a function of compensated shear Rossby number (i.e., Rosh/Roconvℓ) and normalized by its critical value given in Eq. (7). All transitions from dipolar to oscillatory branches collapse on each other. The branch that does not follow the trend is the special case of g ∝ r and the high Ra values (run gr_2 in Table B.1, see Fig. 5d and discussion in Sect. 4.3). Colors, symbols, and lines are the same as in Fig. 7.
Current usage metrics show cumulative count of Article Views (full-text article views including HTML views, PDF and ePub downloads, according to the available data) and Abstracts Views on Vision4Press platform.
Data correspond to usage on the plateform after 2015. The current usage metrics is available 48-96 hours after online publication and is updated daily on week days.
Initial download of the metrics may take a while.