Fig. 12.
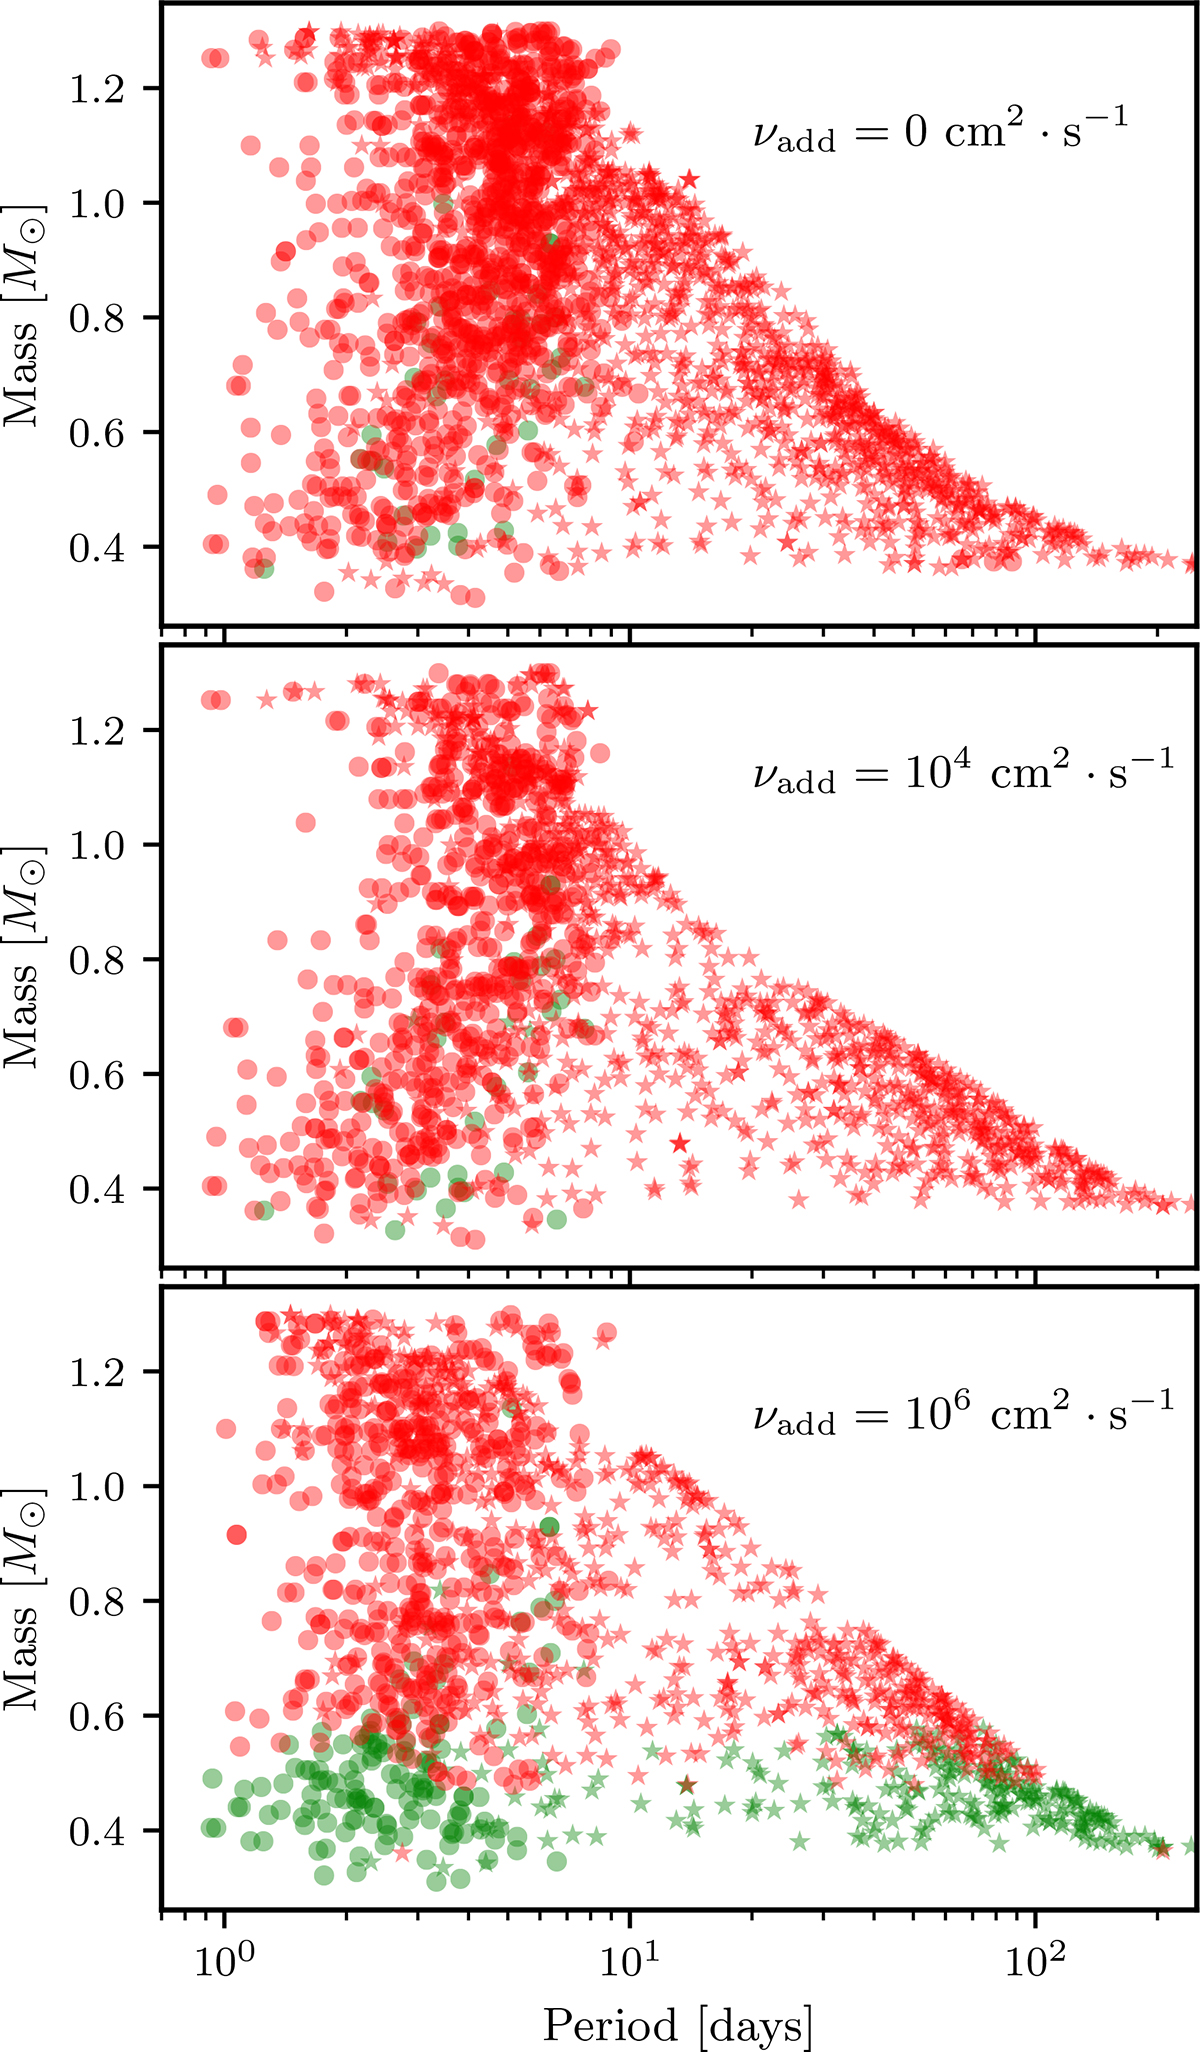
Download original image
Mass-period (surface) distribution of some models randomly chosen in the grids described in Sect. 5.3. The criterion considered for the stability of the dipole is the ratio Rosh, Hp/Roconv, mid with the threshold expressed in Eq. (7). Circles and stars are respectively PMS and MS models. Red (resp. green) markers are models that lost (resp. kept) their dipole between their formation and their present age. Each panel corresponds to a grid with a given additional turbulent viscosity, νadd.
Current usage metrics show cumulative count of Article Views (full-text article views including HTML views, PDF and ePub downloads, according to the available data) and Abstracts Views on Vision4Press platform.
Data correspond to usage on the plateform after 2015. The current usage metrics is available 48-96 hours after online publication and is updated daily on week days.
Initial download of the metrics may take a while.