Fig. C.3.
Download original image
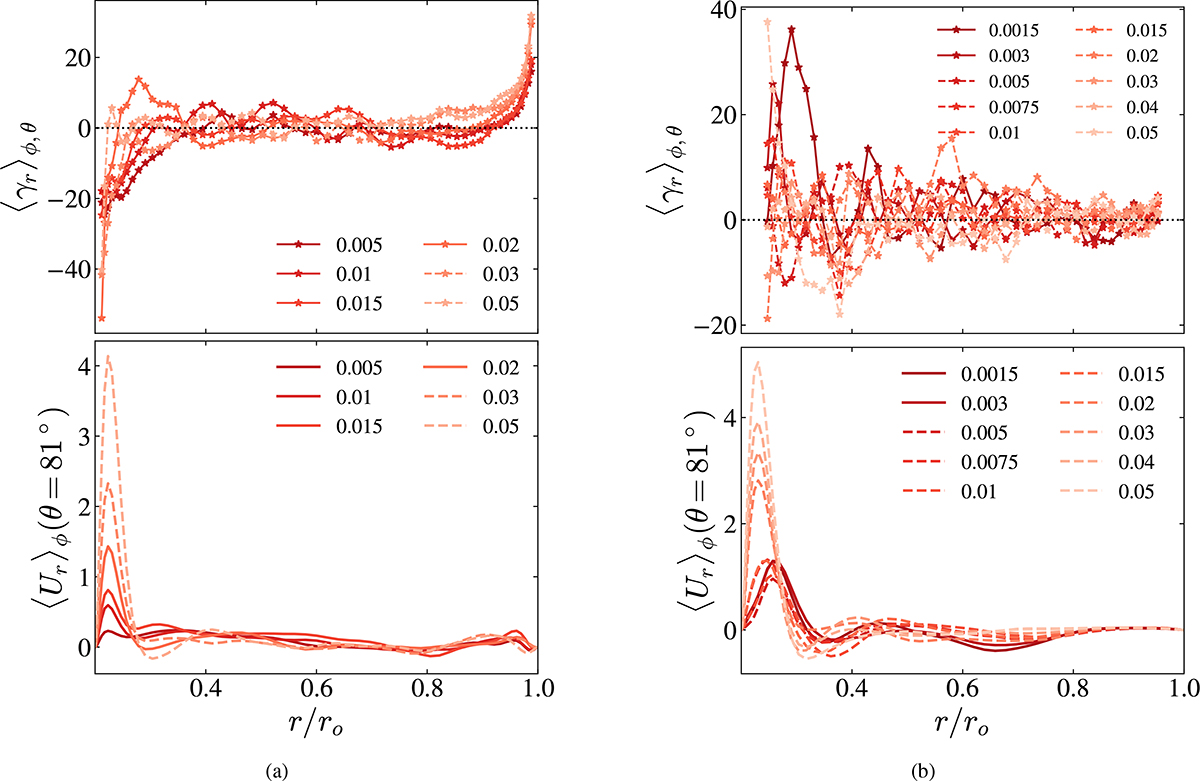
Complementary data to Fig. 9. (a) Top: Radial component of the gamma effect γr as a function of Rosh (given in the legend), averaged over colatitude θ. Bottom: Radial component of meridional circulation near the equator (colatitude of θ = 80°, see the dotted lines in Fig. 8h,l). Solid lines indicate runs where the dipole is stable, and dashed lines to the runs where dipole collapsed. Runs with g ∝ r, Ra = 8 × 10⁶, ξ = 0.2. (b) The same but for g ∝ 1/r2, Ra = 1 × 10⁶, ξ = 0.2. Subscripts ϕ and θ denote azimuthal and latitudinal average, respectively. Same units as in Fig. 3(c-e).
Current usage metrics show cumulative count of Article Views (full-text article views including HTML views, PDF and ePub downloads, according to the available data) and Abstracts Views on Vision4Press platform.
Data correspond to usage on the plateform after 2015. The current usage metrics is available 48-96 hours after online publication and is updated daily on week days.
Initial download of the metrics may take a while.