Fig. 3.
Download original image
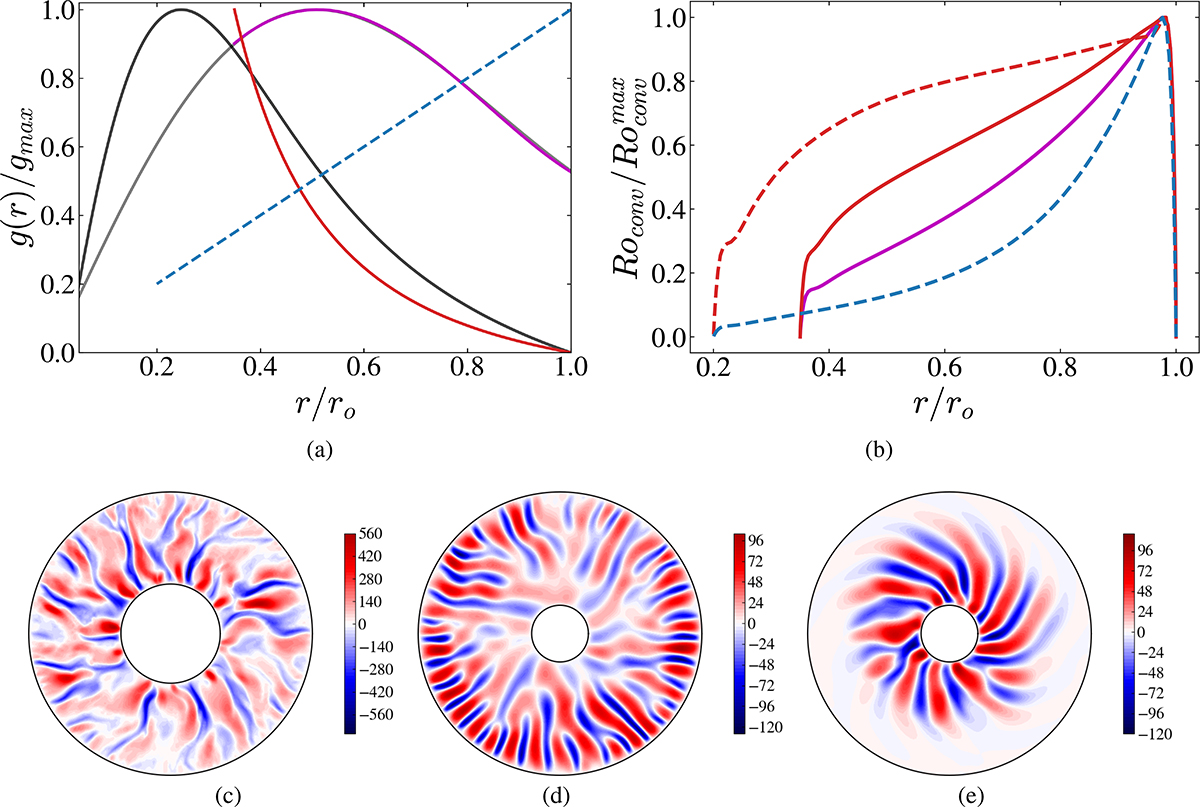
Patterns of convection with different gravity profiles. (a) Normalized gravity profiles from stellar evolution code Cesam2k20 for a star of 0.8 M⊙ at an early stage of stellar evolution (1 Myr, in light gray) and at the MS (4.9 ⋅ 103 Myrs, dark gray). Example of imposed gravity profiles in DNS: g ∝ 1/r2 for radii ratio ξ = 0.35 (in red), g ∝ r and ξ = 0.2 (in dashed light blue) and a typical profile from Cesam2k20 with ξ = 0.35 (in magenta, see Eq. (3) for detail). (b) Local convective Rossby number, normalized with its maximum, as a function of r/ro for the runs gr2_2, gr_1, and gc_2, associated with the gravity profiles of panel (a) (same color code), and for the run gr2_3, with g ∝ 1/r2 and ξ = 0.2 (in dashed red). Details of the runs are presented in Table B.1. (c) Equatorial cut of instantaneous radial velocity for g ∝ 1/r2, ξ = 0.35 (run gr2_2). (d) Same as (c) but for g ∝ r, ξ = 0.2 (run gr_1). (e) Same as (c) but for g ∝ 1/r2, ξ = 0.2 (run gr2_3). Velocities in panels (c-e) were normalized with ν/(ro − ri), i.e., kinematic viscosity, ν, and the thickness of convective zone.
Current usage metrics show cumulative count of Article Views (full-text article views including HTML views, PDF and ePub downloads, according to the available data) and Abstracts Views on Vision4Press platform.
Data correspond to usage on the plateform after 2015. The current usage metrics is available 48-96 hours after online publication and is updated daily on week days.
Initial download of the metrics may take a while.