Fig. 2
Download original image
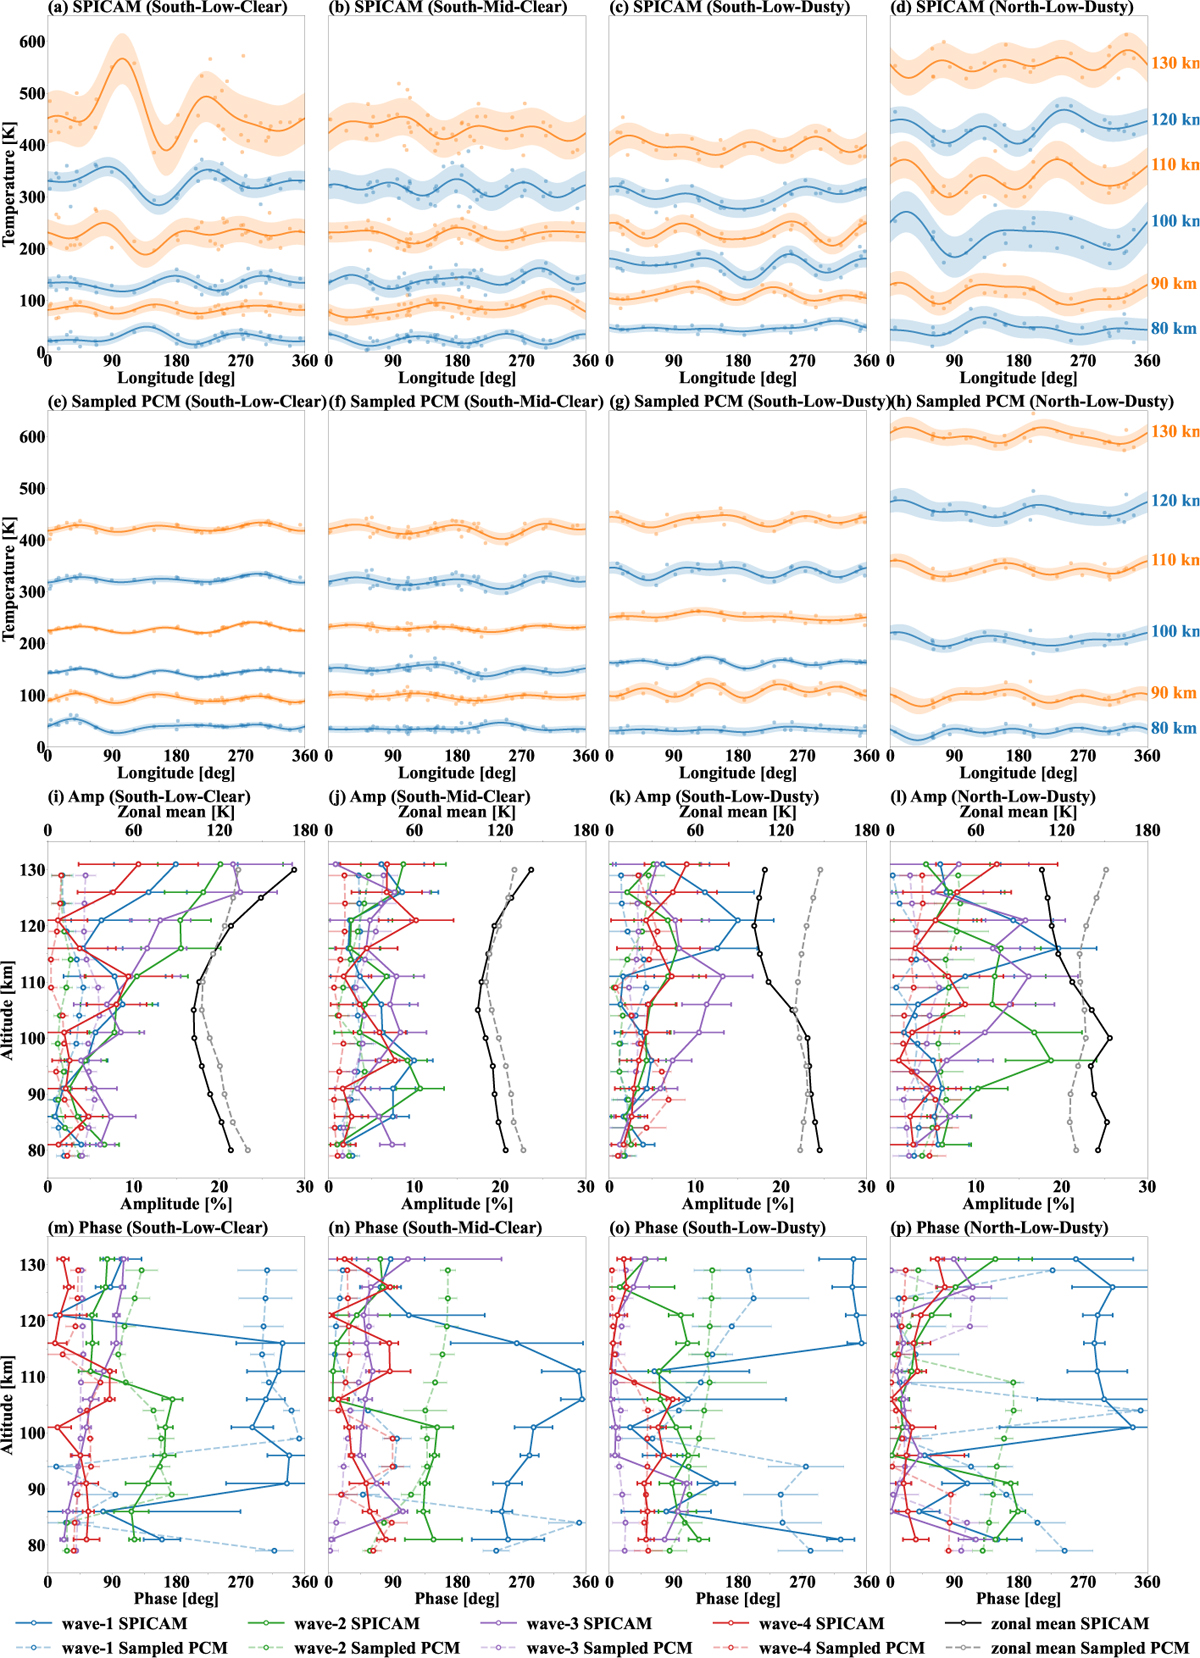
Longitudinal structures of SPICAM temperature observations for (a) South-Low-Clear, (b) South-Mid-Clear, (c) South-Low-Dusty, and (d) North-Low-Dusty. Panels (e)–(h) show the corresponding structures from sampled PCM data. Dots indicate data points and shaded regions represent ±1σ uncertainties of the composite fits. Panels (i) to (l) show the amplitudes and ±1σ uncertainties of waves 1–4, normalized by the zonal mean for the four cases in (a)–(d). For clarity, the SPICAM and sampled PCM profiles are vertically offset by +1 km and −1 km, respectively. The SPICAM amplitudes use dashed semi-transparent lines; PCM amplitudes use solid, opaque lines. Panels (m)–(p) show the corresponding phases and ±1σ uncertainties, defined as the longitude of the first eastward peak from 0◦ for each harmonic component. The temperature structures in the first two rows are vertically offset by [−100, −30, 30, 120, 200, 290] K for 80–130 km altitudes, except for the North-Low-Dusty case, which uses [−100, −30, 70, 210, 320, 450] K.
Current usage metrics show cumulative count of Article Views (full-text article views including HTML views, PDF and ePub downloads, according to the available data) and Abstracts Views on Vision4Press platform.
Data correspond to usage on the plateform after 2015. The current usage metrics is available 48-96 hours after online publication and is updated daily on week days.
Initial download of the metrics may take a while.