Open Access
Fig. D.1
Download original image
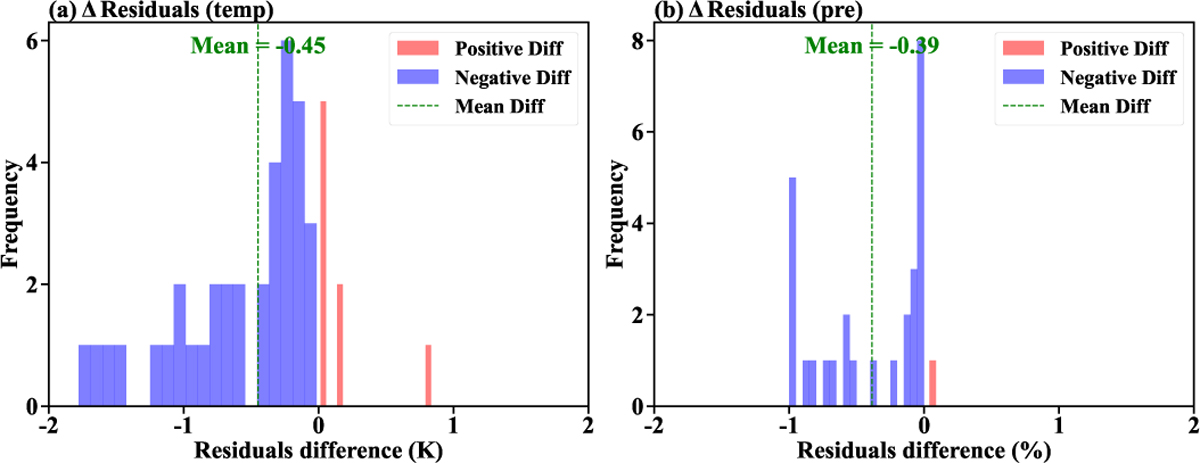
(a) Histograms of the difference between the residuals from wave-1 to wave-4 fits and those from wave-1 to wave-3 fits for the temperature field. (b) Same as (a), but for the pressure field. Residual differences in the pressure field are normalized by the maximum difference.
Current usage metrics show cumulative count of Article Views (full-text article views including HTML views, PDF and ePub downloads, according to the available data) and Abstracts Views on Vision4Press platform.
Data correspond to usage on the plateform after 2015. The current usage metrics is available 48-96 hours after online publication and is updated daily on week days.
Initial download of the metrics may take a while.