Fig. 11
Download original image
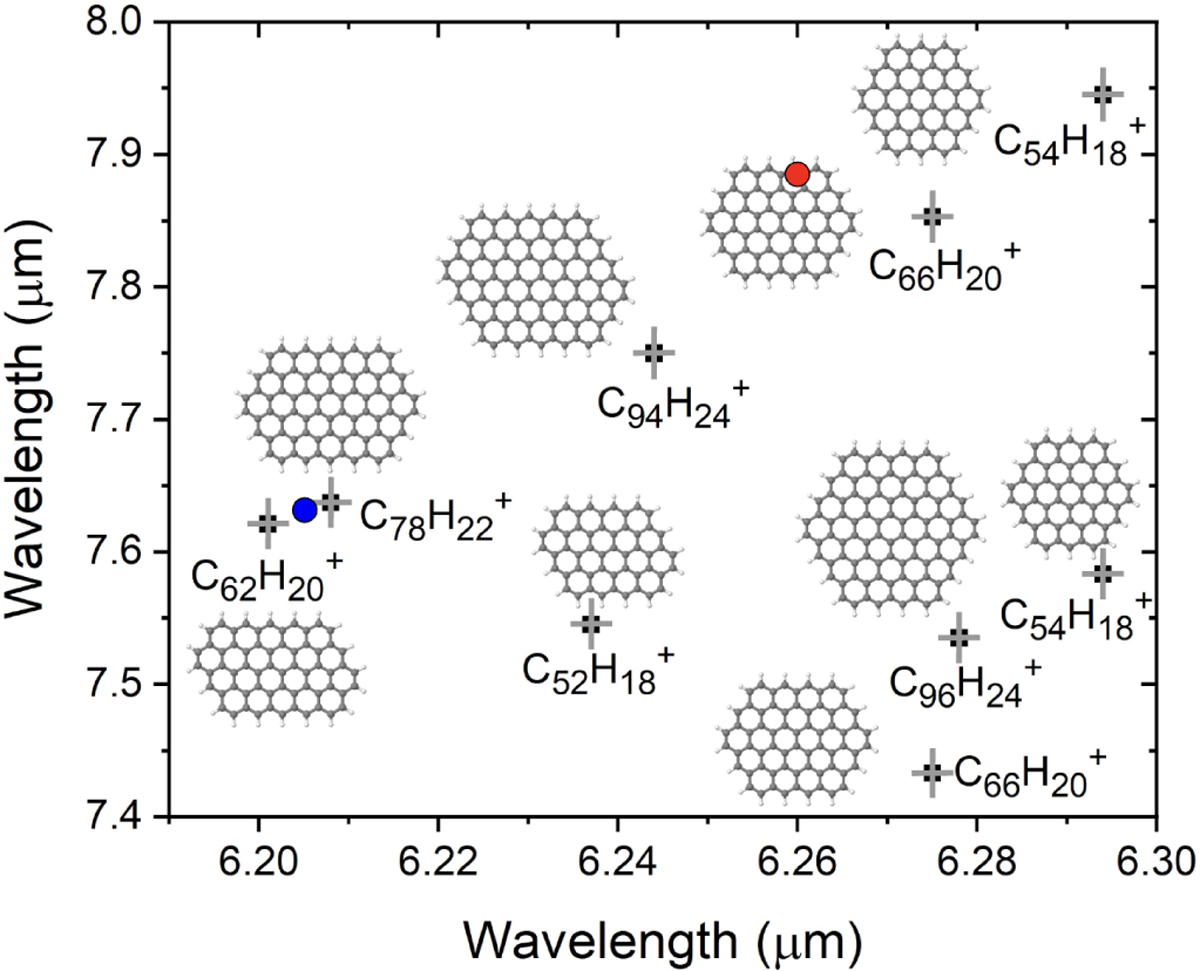
6.2 and 7.7 μm peak positions of seven cationic PAH species (data taken from Ricca et al. 2021). Uncertainties for the theoretical band positions, calculated in Mackie et al. (2016, 2018) and Lemmens et al. (2019), are shown by the gray error bars (for details see Appendix H). The blue and red circles represent the observed peak positions of the blue and red components of the 6.2 and 7.7 μm bands in NGC 7027, respectively.
Current usage metrics show cumulative count of Article Views (full-text article views including HTML views, PDF and ePub downloads, according to the available data) and Abstracts Views on Vision4Press platform.
Data correspond to usage on the plateform after 2015. The current usage metrics is available 48-96 hours after online publication and is updated daily on week days.
Initial download of the metrics may take a while.