Fig. F.1
Download original image
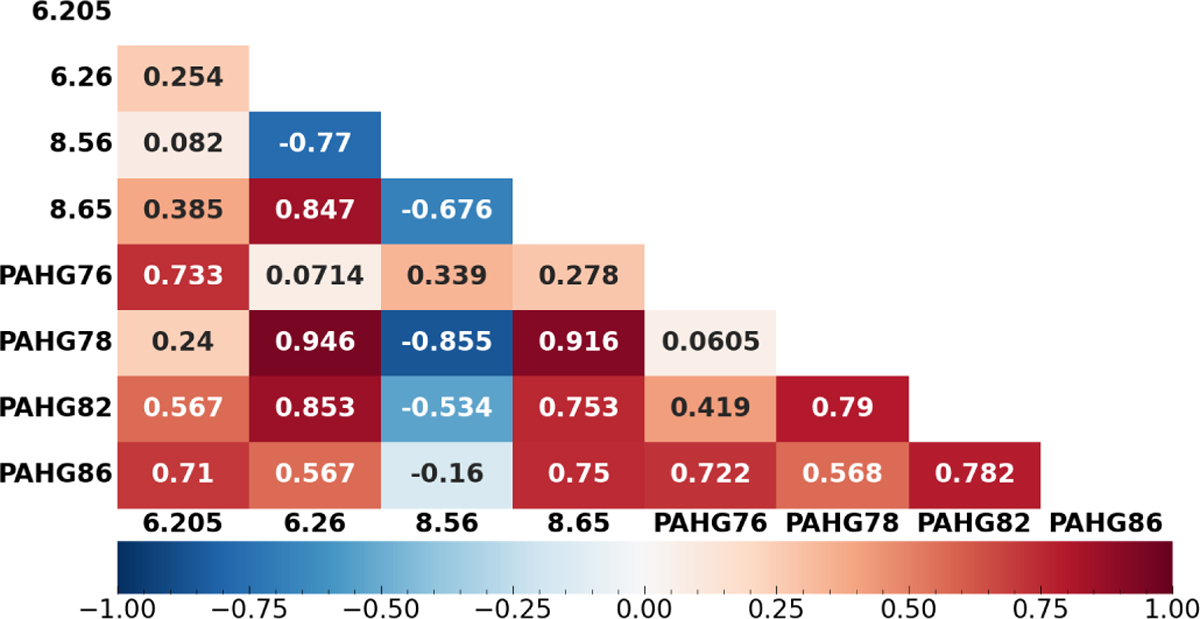
Heat-map demonstrating the strength of correlations between the 6-9 μm components when normalized to the 11.207 μm PAH component, where the intersection between two components displays their correlation coefficient. Redder boxes indicate a strong correlation, bluer boxes indicate a strong anticorrelation, and light boxes are present when there is little-to-no correlation.
Current usage metrics show cumulative count of Article Views (full-text article views including HTML views, PDF and ePub downloads, according to the available data) and Abstracts Views on Vision4Press platform.
Data correspond to usage on the plateform after 2015. The current usage metrics is available 48-96 hours after online publication and is updated daily on week days.
Initial download of the metrics may take a while.