Open Access
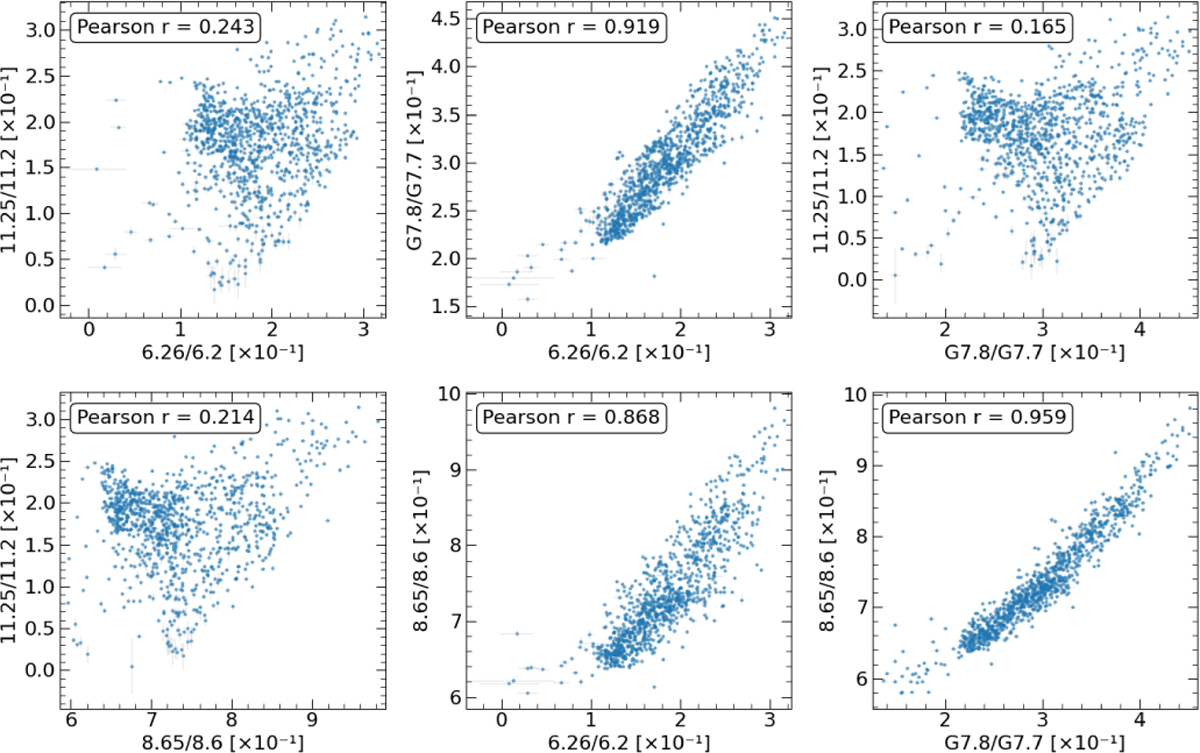
Fig. F.2
Download original image
Correlation plots between the 6.26, 7.8, 8.65, and 11.25 μm components normalized over their feature totals. The Pearson correlation coefficient is shown in the top left corner of the plots. Error bars are shown in light gray.
Current usage metrics show cumulative count of Article Views (full-text article views including HTML views, PDF and ePub downloads, according to the available data) and Abstracts Views on Vision4Press platform.
Data correspond to usage on the plateform after 2015. The current usage metrics is available 48-96 hours after online publication and is updated daily on week days.
Initial download of the metrics may take a while.