Fig. 5
Download original image
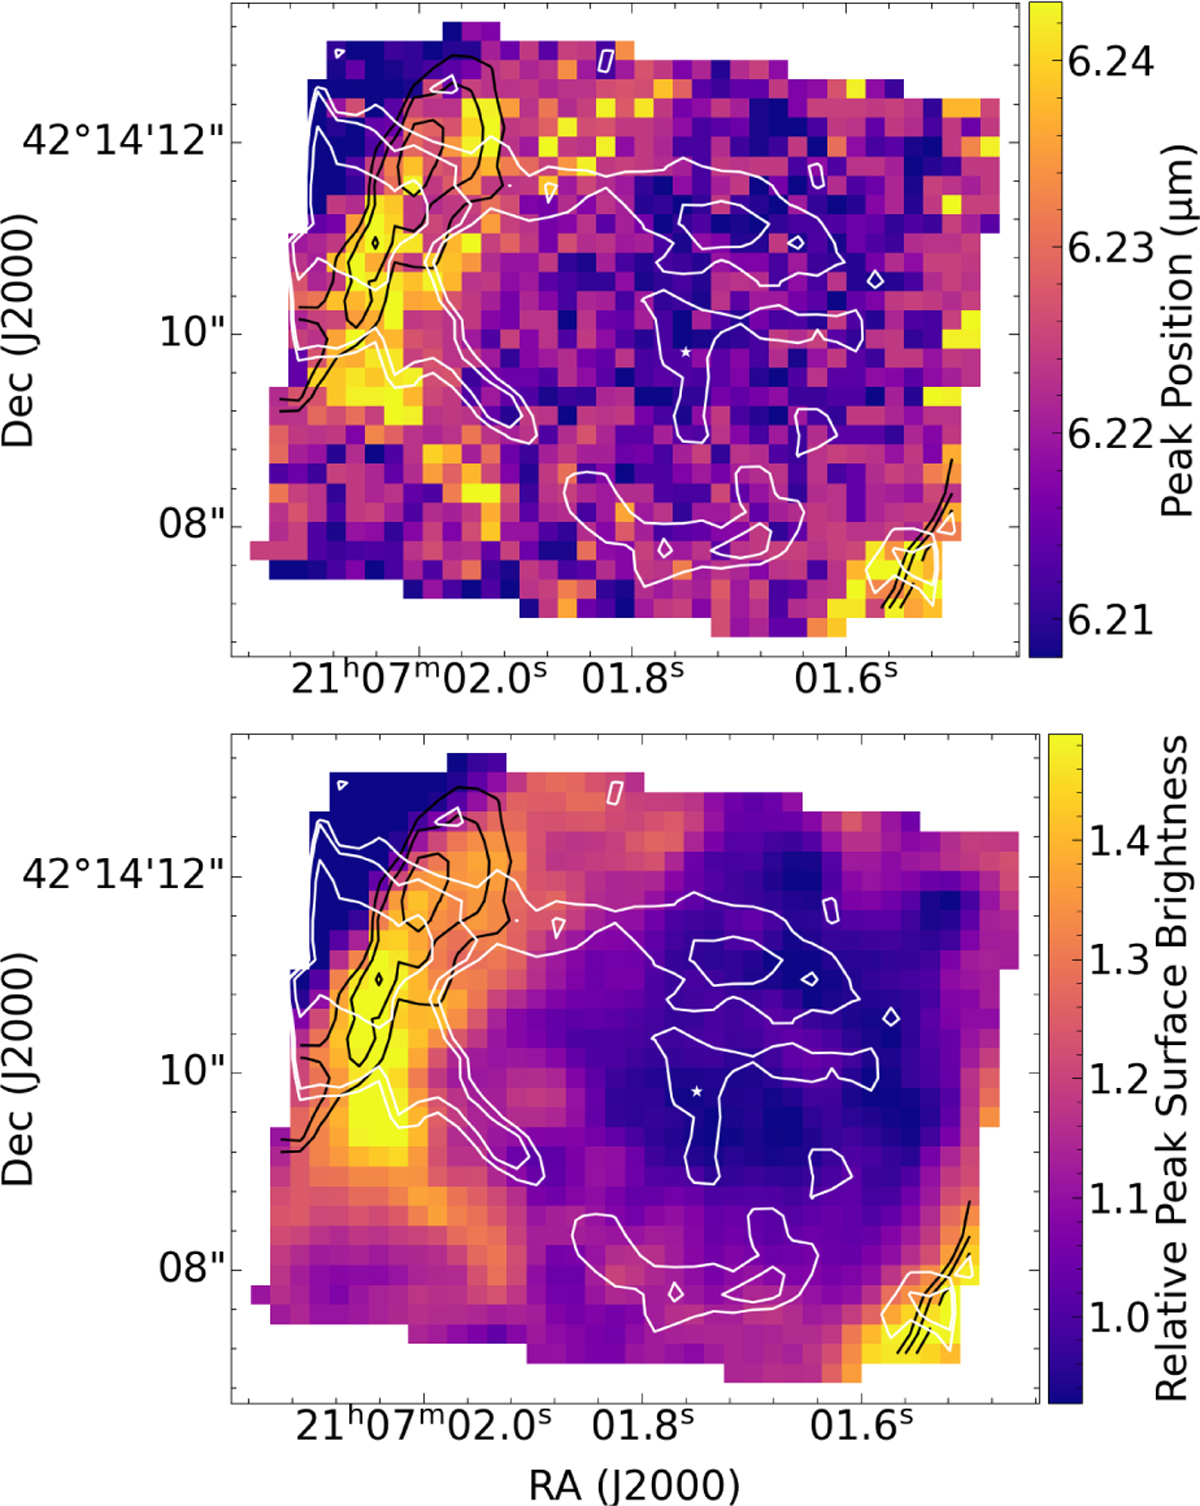
Illustration of the profile variability with the peak position of the 6.2 μm PAH band (top) and the relative peak surface brightness of the 7.8 μm component with respect to the 7.6 μm component (bottom). Black and white contours represent the integrated 6.2 μm PAH surface brightness and the H2 0–0 S(7) integrated surface brightness, respectively (Fig. A.1).
Current usage metrics show cumulative count of Article Views (full-text article views including HTML views, PDF and ePub downloads, according to the available data) and Abstracts Views on Vision4Press platform.
Data correspond to usage on the plateform after 2015. The current usage metrics is available 48-96 hours after online publication and is updated daily on week days.
Initial download of the metrics may take a while.