Fig. 9
Download original image
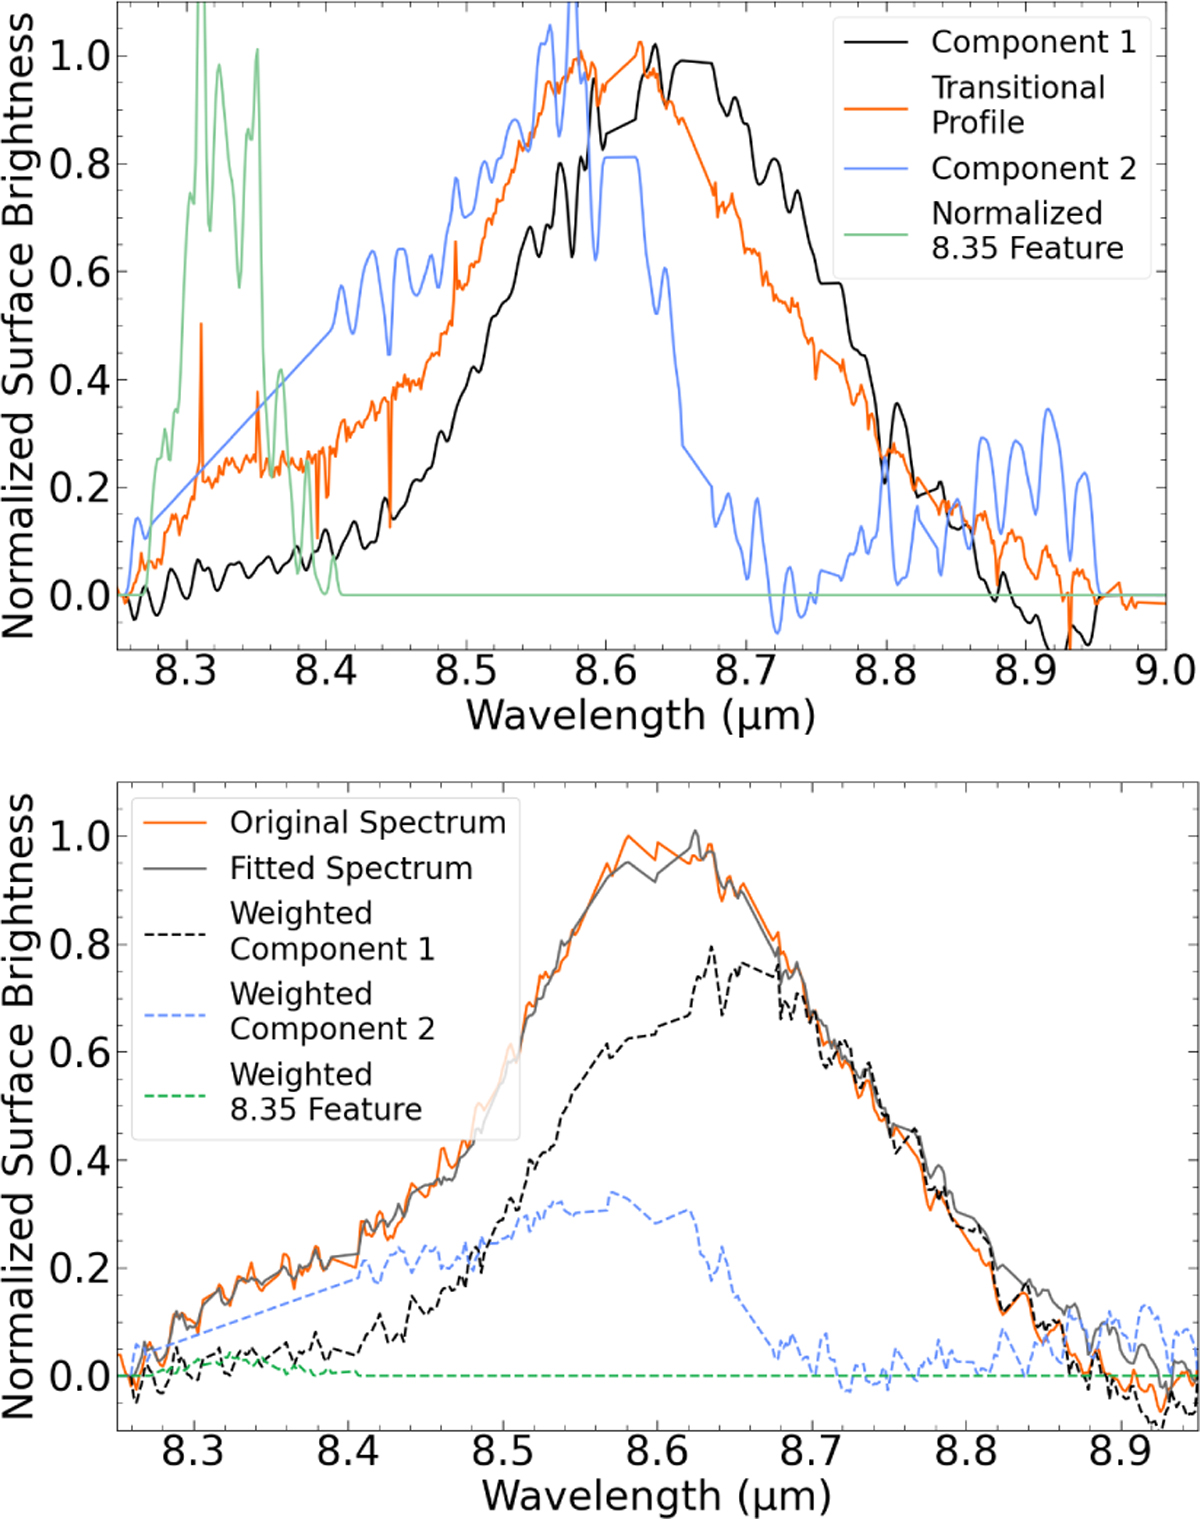
Illustration of the decomposition of the 8.6 μm PAH band. Top: normalized profiles of the redshifted profile representing class ℬ (the first component), the blueshifted profile representing class 𝒜 (the transitional profile), the derived second component used in the decomposition, and the extracted 8.35 μm feature. Bottom: typical decomposition of the 8.6 μm band with components 1 and 2, and the 8.35 μm feature.
Current usage metrics show cumulative count of Article Views (full-text article views including HTML views, PDF and ePub downloads, according to the available data) and Abstracts Views on Vision4Press platform.
Data correspond to usage on the plateform after 2015. The current usage metrics is available 48-96 hours after online publication and is updated daily on week days.
Initial download of the metrics may take a while.