Open Access
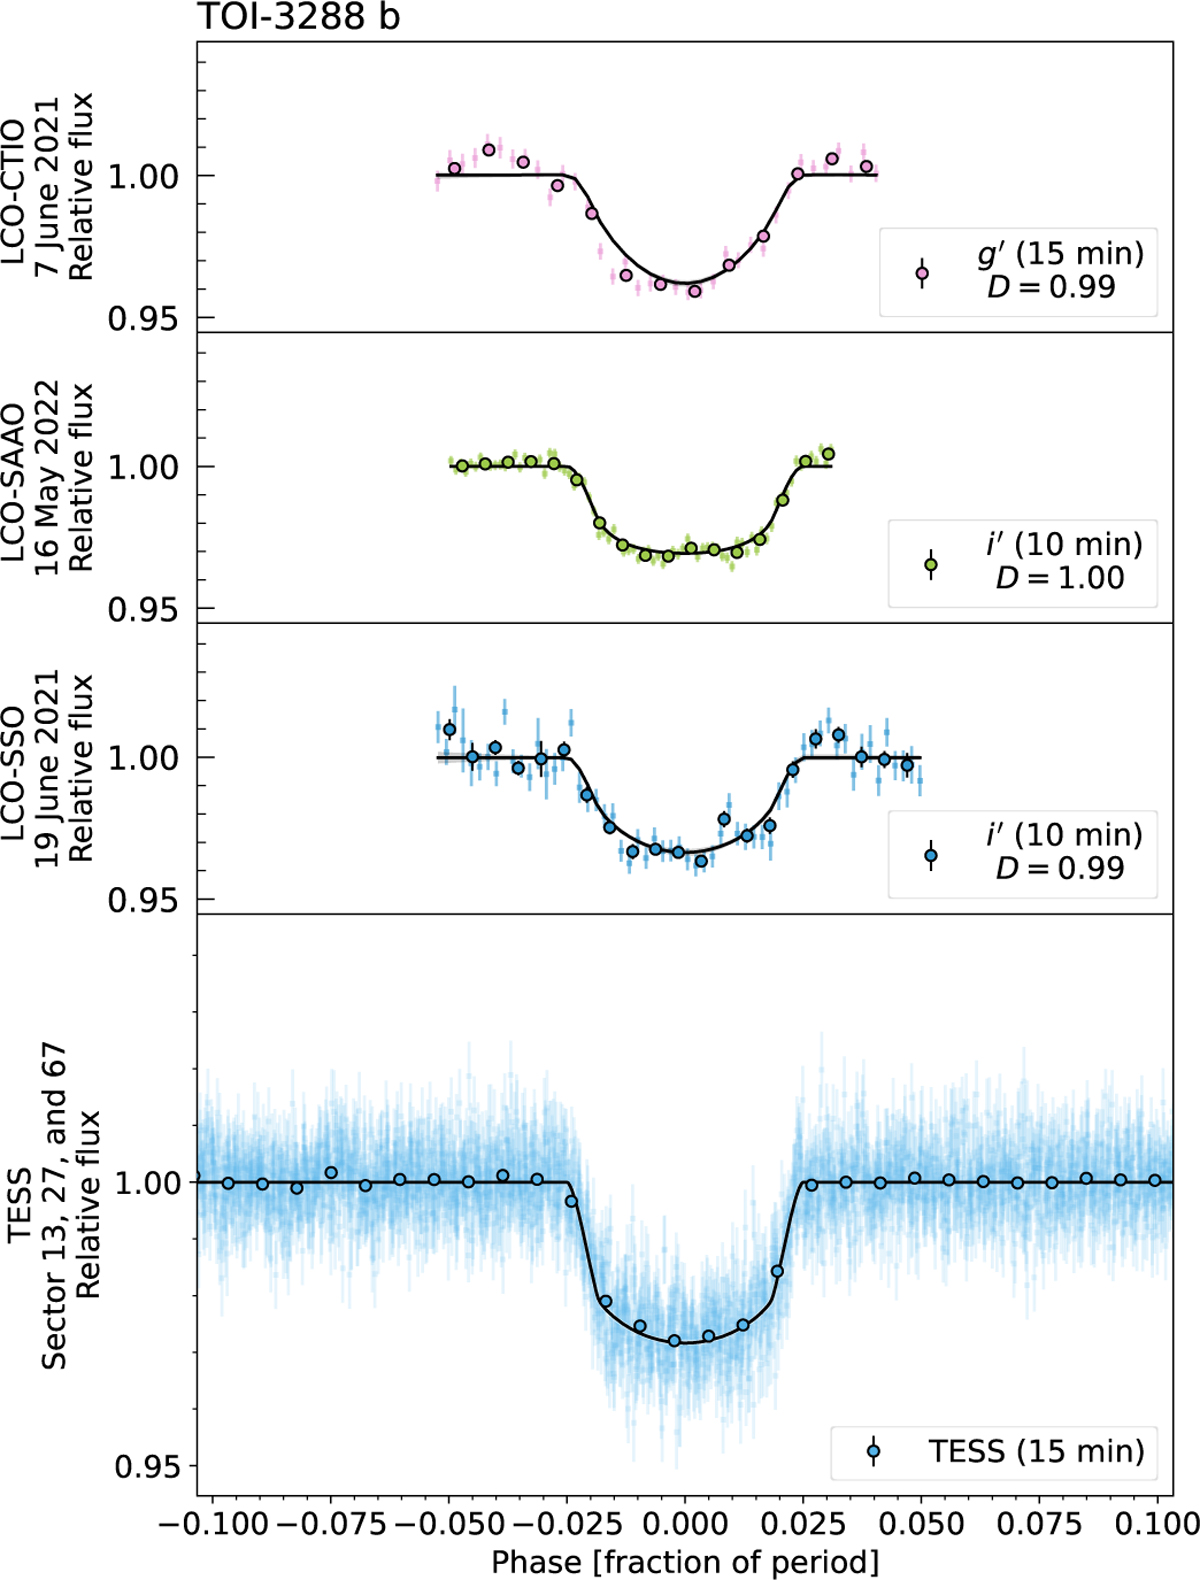
Fig. 4
Download original image
Phase-folded light curves of TOI-3288 from TESS-SPOC, QLP, and LCO (SSO, SAAO, and CTIO). If a dilution factor was fitted, it is indicated in the legend of each subpanel. Markers with black edges represent data binned per 10 or 15 minutes, as is noted in the legend.
Current usage metrics show cumulative count of Article Views (full-text article views including HTML views, PDF and ePub downloads, according to the available data) and Abstracts Views on Vision4Press platform.
Data correspond to usage on the plateform after 2015. The current usage metrics is available 48-96 hours after online publication and is updated daily on week days.
Initial download of the metrics may take a while.