Fig. 4
Download original image
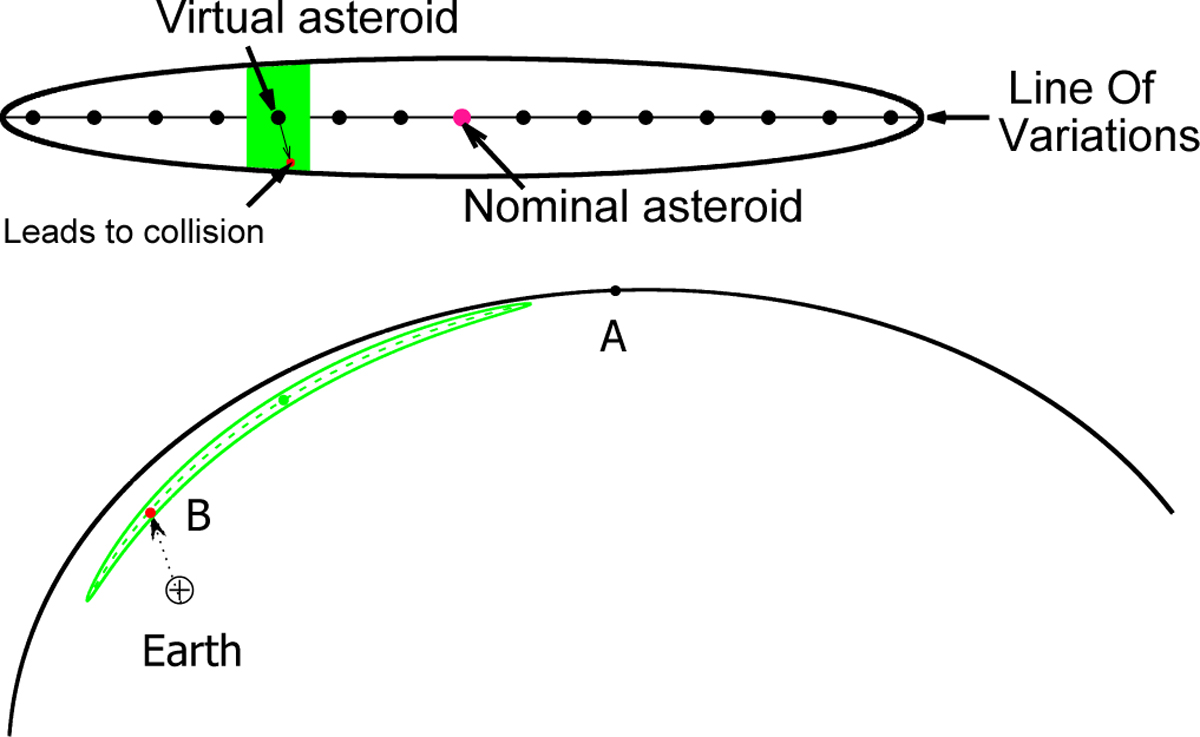
Schematic illustration of the work of NEOForCE system. In the upper panel, one can see the nominal asteroid (purple dot), the original uncertainty region at the epoch of observation (black ellipse), the LOV (horizontal line), and VAs sampled along the LOV (black dots). The green area represents the smaller uncertainty region assigned to this VA. The red denotes the VI. In the bottom panel, one can see the nominal position of the asteroid at time slightly before a possible collision, t (point A), the osculating orbit of the nominal asteroid (black part of an ellipse), the Earth, the position of the VA (green dot), and the uncertainty region assigned for this VA at time slightly before t (curved green ellipse). The red dot (point B) represents the position of the VI. The dashed vector shows the relative motion of the Earth and the green uncertainty region. The Earth collides with the red dot.
Current usage metrics show cumulative count of Article Views (full-text article views including HTML views, PDF and ePub downloads, according to the available data) and Abstracts Views on Vision4Press platform.
Data correspond to usage on the plateform after 2015. The current usage metrics is available 48-96 hours after online publication and is updated daily on week days.
Initial download of the metrics may take a while.