Fig. 6
Download original image
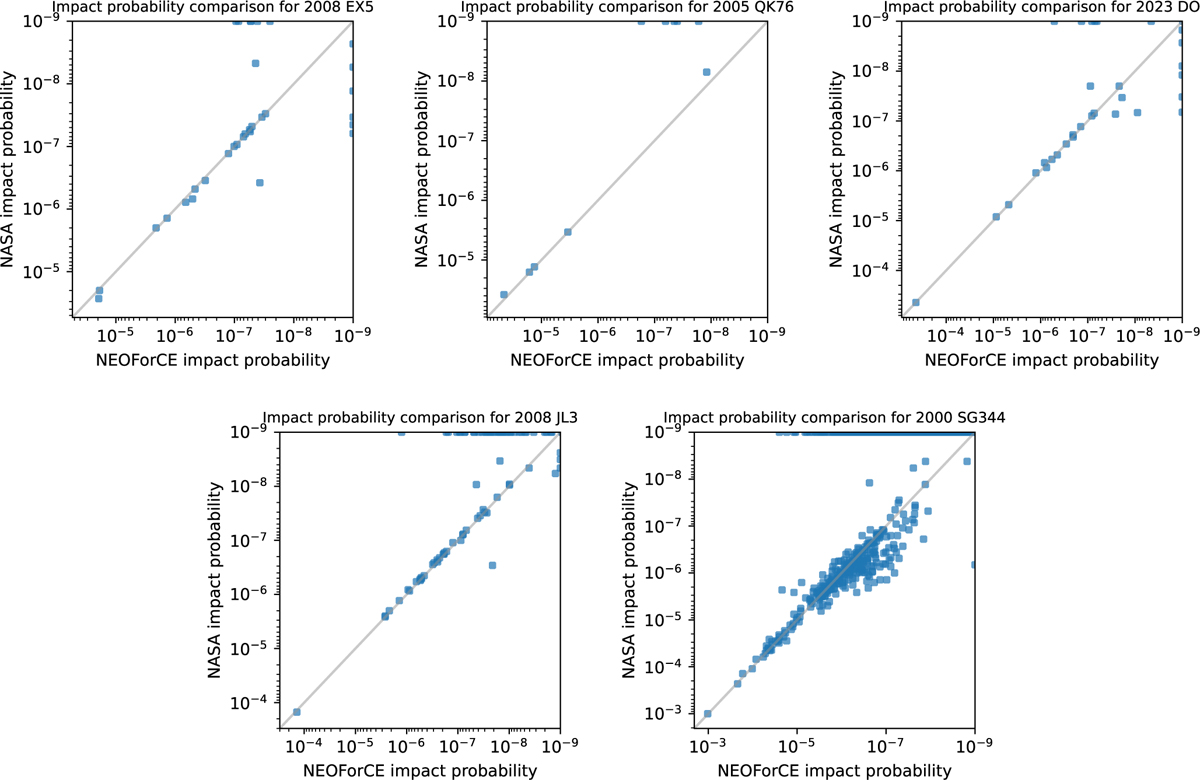
Comparison between the NEOForCE impact monitoring system and Sentry-II. This figure summarizes the results from Tables 1–5. We show only impact probabilities larger than 10−9. A point located on the horizontal line at PNASA = 10−9 indicates a potential impact identified by NEOForCE but not detected by Sentry-II. Conversely, a point on the vertical line indicates an impact detected by Sentry-II but not found by NEOForCE.
Current usage metrics show cumulative count of Article Views (full-text article views including HTML views, PDF and ePub downloads, according to the available data) and Abstracts Views on Vision4Press platform.
Data correspond to usage on the plateform after 2015. The current usage metrics is available 48-96 hours after online publication and is updated daily on week days.
Initial download of the metrics may take a while.