| Issue |
A&A
Volume 707, March 2026
|
|
|---|---|---|
| Article Number | A378 | |
| Number of page(s) | 8 | |
| Section | Extragalactic astronomy | |
| DOI | https://doi.org/10.1051/0004-6361/202557658 | |
| Published online | 20 March 2026 | |
Polarisation angle variability in tidal disruption events
1
Institute of Astrophysics, FORTH, N.Plastira 100, Vassilika Vouton, 70013, Heraklion, Greece
2
Department of Physics University of Crete, Voutes University Campus, 70013, Heraklion, Greece
3
National Institute for Astrophysics (INAF), Astronomical Observatory of Padova, IT-35122, Padova, Italy
4
Institutt for Fysikk, Norwegian University of Science and Technology, Høgskloreringen 5, Trondheim, 7491, Norway
5
Department of Physics and Astronomy, 20014, University of Turku, Finland
6
Finnish Centre for Astronomy with ESO (FINCA), Quantum, Vesilinnantie 5, 20014, University of Turku, Finland
7
Instituto de Astrofísica de Andalucía, IAA-CSIC, Glorieta de la Astronomía s/n, 18008, Granada, Spain
8
Center for Astrophysics | Harvard & Smithsonian, 60 Garden Street, Cambridge, MA, 02138, USA
⋆ Corresponding author: This email address is being protected from spambots. You need JavaScript enabled to view it.
Received:
11
October
2025
Accepted:
17
February
2026
Abstract
Context. Tidal disruption events (TDEs) occur when a star is disrupted by the tidal forces of a supermassive black hole, and these events produce bright multi-wavelength flares. Polarimetric measurements of TDEs allow us to disentangle the geometry and the mechanisms characterising the accretion process.
Aims. We carried out the first systematic study of the time evolution of the optical polarisation angle (Θ) in a sample of classified TDEs, combining our own data with all available measurements from the literature, with the goal of testing the currently available models that describe TDE emission.
Methods. We assembled data from all available observing epochs with significant linear polarisation detections (Π − 3σΠ > 0%) for sources with at least two such epochs, and we determined the overall variability trends across the sample in various time frames, such as days from peak time and the fallback time (t0) derived from the different models.
Results. Our final sample comprises 12 transients, including three Bowen fluorescence flares (BFFs). The majority of the sources show significant Θ variability. The distribution of |dΘ/dt| peaks near ∼2° d−1. BFFs tend to display sustained late-time Θ evolution, likely due in part to their slower fading. No universal trend emerges when time is normalised by t0.
Conclusions. Short-timescale Θ variability is common in TDEs and is difficult to reconcile with simple axisymmetric reprocessing models that predict a constant polarisation angle. The observed phenomenology favours scenarios with evolving, non-axisymmetric geometries and/or shocks, possibly coupled with changes in optical depth. Denser polarimetric monitoring, contemporaneous spectroscopy, and X-ray/UV coverage are required to break the remaining degeneracies.
Key words: techniques: polarimetric / galaxies: active / galaxies: nuclei
© The Authors 2026
 Open Access article, published by EDP Sciences, under the terms of the Creative Commons Attribution License (https://creativecommons.org/licenses/by/4.0), which permits unrestricted use, distribution, and reproduction in any medium, provided the original work is properly cited.
This article is published in open access under the Subscribe to Open model. This email address is being protected from spambots. You need JavaScript enabled to view it. to support open access publication.
1. Introduction
Tidal disruption events (TDEs) are luminous transients that occur when a star approaches a supermassive black hole (SMBH) close enough for the tidal field of the SMBH to overwhelm the star’s self-gravity, shredding the star and liberating a large fraction of its gravitational binding energy (Hills 1975; Rees 1988; Komossa 2015). The ensuing flare radiates across the X-ray, ultraviolet (UV), optical, and infrared (IR) bands, yet the mechanism that powers this emission remains unclear. Delayed radio flares have also been observed in several sources (Alexander et al. 2025)
Two broad families of models have been proposed. In the reprocessing scenario, a compact accretion disc quickly forms and emits soft X-rays and extreme-UV photons that are thermalised in an optically thick, quasi-spherical envelope at radii far larger than the tidal radius, producing the near UV–optical continuum (Metzger & Stone 2016; Dai et al. 2018). In contrast, shock-powered models attribute the luminosity to kinetic energy released when the highly eccentric debris streams self-intersect at large apocentric distances, converting orbital energy into heat and radiation (Piran et al. 2015; Shiokawa et al. 2015). There is observational evidence that supports both pictures: narrow line emission triggered by resonant He II and Lyman α pumping of O III] and N III (Bowen fluorescence) and forbidden transitions from highly ionised species that require a hard ionising continuum (coronal lines, e.g. [Fe X] and [Fe XIV]; Leloudas et al. 2019; Blagorodnova et al. 2019; Trakhtenbrot et al. 2019; Koljonen et al. 2024) point to a buried X-ray source, whereas the rapidly variable polarisation reported in several TDEs (Koljonen et al. 2024, 2025; Floris et al. 2025), as well as high-degree optical polarisation (e.g. Π ∼ 25% in AT 2020mot; Liodakis et al. 2023) and X-ray brightening events after the optical-UV peak (Kajava et al. 2020), point to an aspherical, evolving scattering- or shock-dominated geometry, and possibly ordered magnetic fields. However, late X-ray brightenings have also been interpreted as a reprocessing layer becoming optically thin (e.g. Guolo et al. 2024; Reynolds et al. 2026; Earl et al. 2025).
Polarimetry is uniquely sensitive to the geometry and magnetic-field structure and can potentially solve this ambiguity. In the rare class of jetted TDEs, the synchrotron emission from the jet should be intrinsically polarised. The first jetted-TDE observations found a Π of ∼7 − 8% near the peak that decreased as the events faded (the first one being a 2σ detection; Wiersema et al. 2012b, 2020). However, the most recent jetted TDE, AT2022cmc, exhibited no significant polarisation in the rest-frame UV when observed approximately 10 days after peak brightness (Cikota et al. 2023). In optical TDEs with no evidence of jet emission, the linear polarisation is expected to arise predominantly from electron scattering. The polarisation degree (Π) measures the departure from spherical symmetry, while the polarisation angle (Θ) traces the projected orientation of the scattering geometry–or, when an ordered magnetic field is present, the field’s direction itself. Systematic changes in Θ have long been recognised as key diagnostics in other compact-object systems, for example:
-
Blazars: Smooth, large-amplitude Θ of > 90° typically occur on timescales of days to weeks and are frequently contemporaneous with gamma-ray flares (e.g. Blinov et al. 2015; Kiehlmann et al. 2016; Agudo et al. 2018).
-
Gamma-ray bursts (GRBs): Afterglow monitoring of GRB 091018 and similar events has revealed ∼90° swings in Θ near the jet-break time, consistent with geometric models of off-axis expanding jets (e.g. Wiersema et al. 2012a).
-
X-ray binaries (XRBs): In the XRB source 4U 0115+63, Θ evolved by ∼20° over a single outburst, tracing the precession of a warped accretion disc (e.g. Reig & Blinov 2018). Rapid, lower-amplitude changes – and occasional polarised flares – were also reported in the black-hole transient V404Cyg during its 2015 outburst (e.g. Shahbaz et al. 2016).
-
Magnetars: Observations of 4U 0142+61 with the Imaging X-ray Polarimetry Explorer (IXPE) uncovered an energy-dependent 90° rotation of the X-ray polarisation angle at 4–5 keV, potentially due to quantum-electrodynamic mode conversion in the magnetised atmosphere (Taverna et al. 2022).
Analogous behaviour in TDEs could offer a direct probe of disc formation, stream dynamics, and magnetic-field topology. Indeed, coordinated variability in Π and Θ has been reported for AT2020mot and AT2023clx (Koljonen et al. 2025) when time is expressed in units of fallback time (t0), pointing to the possibility of a common evolution scenario.
Additionally, recent spectropolarimetry of the nearby TDE AT2023clx supports the hypothesis that the observed polarisation arises from scattering in a dusty torus around the SMBH (Uno et al. 2025), although alternative interpretations involving shocks have also been proposed (Koljonen et al. 2025). The latter scenario would most naturally apply to events occurring within a pre-existing active galactic nucleus. Seyfert galaxies, for example, exhibit electron-scattering-dominated polarisation and a bimodal distribution of Π, with Seyfert 1 galaxies showing systematically lower polarisation than Seyfert 2 galaxies (Hutsemékers et al. 2017). The polarisation angle, however, is generally found to remain approximately constant in the majority of studied sources, even when Π varies over time, in both optical and X-ray polarimetry (Antonucci 1982; Gaskell et al. 2012; Marin 2017; Marin et al. 2024).
During our dedicated time-domain polarimetric campaign targeting TDEs, the Black hOle Optical polarization TimE-domain Survey (BOOTES), we found that most events are either consistent with 0% polarisation within the errors or show Π ≲ 6% at single epochs, and are thus still compatible with both reprocessing and shock-powered scenarios (Floris et al. 2025). However, the discovery of Θ variability and Π excursions well above the ≲6% limit (Liodakis et al. 2023; Koljonen et al. 2024, 2025; Floris et al. 2025) expected for pure electron-scattering envelopes (Leloudas et al. 2022) suggests that, at least in some TDEs, the scattering region is highly aspherical, dynamically evolving, and possibly threaded by ordered magnetic fields.
Motivated by these findings, we present the first systematic study of the temporal evolution of Θ in a sample of optically selected TDEs observed as part of BOOTES and supplemented with all publicly available data from the literature. In Sect. 2 we present the source sample used in this work, together with new polarimetric observations. The results are presented in Sect. 3, and the implications derived from them are discussed in Sect. 4. We provide a summary of our conclusions in Sect. 5. Throughout this paper we adopt a flat Λ cold dark matter cosmology with H0 = 67.4 km s−1 Mpc−1, ΩM = 0.315, and ΩΛ = 0.685 (Planck Collaboration VI 2020).
2. Sample
The sample used in this work consists of the observations presented in Floris et al. (2025) and taken as part of the BOOTES observation campaign, complemented with new observations of AT2024pvu and by all literature measurements with at least two significant detections of Π (i.e. Π − 3σΠ > 0%), ensuring reliable Θ estimates and temporal tracking. We included all literature data satisfying this criterion in our analysis; these measurements were drawn from Leloudas et al. (2022), Koljonen et al. (2024, 2025), Jordana-Mitjans et al. (2025), and Floris et al. (2025). We re-analysed Nordic Optical Telescope (NOT) data for AT2019dsg from Lee et al. (2020) and obtained lower polarisation values, which we adopted in this work. The data were analysed using the semi-automatic pipeline for NOT polarimetric data (Hovatta et al. 2016), which has been repeatedly tested on faint targets, including TDEs (Koljonen et al. 2024, 2025; Floris et al. 2025). We also included imaging polarimetry data from Very Large Telescope (VLT) archival observations of TDEs AT2020zso and AT2021blz. The final sample comprises 12 sources, three of which (AT2019aalc, AT2020afhd, and AT2022fpx) have also been suggested to be Bowen fluorescence flares (BFFs) due to prominent Bowen lines.
To maximise temporal coverage, we combined measurements across filters after verifying the Θ values are consistent between bands; for electron-scattering, Θ is expected to be approximately achromatic at a fixed geometry. To reduce noise and redundancy, we adopted a minimum cadence of one day and retained the most precise measurement per epoch (typically R band for NOT, V band for VLT, and L band for the Liverpool Telescope (LT) from Jordana-Mitjans et al. 2025).
We computed |ΔΘ/Δt| between adjacent detections and constructed per-source histograms. Where needed, we unwrapped the 180° ambiguity by requiring continuity in (q, u) space. All reported uncertainties are propagated from the Stokes parameter errors. We report additional observations from the BOOTES campaign, VLT, and re-analysed NOT data from Lee et al. (2020) in Table A.1. The measurements have been processed similarly to Floris et al. (2025) but were not host-corrected. As a matter of fact, in the assumption of an unpolarised host galaxy, Θ is not expected to change during host correction (Floris et al. 2025). While this work was under review, additional TDE polarimetric observations were published in Wichern et al. (2026), including of AT2020zso and AT2021blz, which we also present in Table A.1. These data were not utilised in our analysis; however, for these observations we verified that our measurements and those reported in Wichern et al. (2026) are consistent within 3σ.
3. Results
In this work we quantified Θ variability via adjacent-epoch rates and per-object amplitudes, selecting the measurements by adopting the methodology described in Sect. 2. We estimated the rate of change of the polarisation angle (|ΔΘ/Δt|) in a manner analogous to studies of blazars (Blinov et al. 2016), providing a benchmark against which future models can be tested. At present, no model predicts a specific |ΔΘ/Δt|, with the exception of an axisymmetric reprocessing scenario that implies |ΔΘ/Δt|∼0° d−1 on short timescales. Figure 1 shows that the distribution of |ΔΘ/Δt| follows a log-normal distribution that peaks at 1.90° d−1, with a standard deviation of σ = 3.78° d−1 (shown as the red curve overplotted on the histogram). We verified this assumption with the Kolmogorov-Smirnov and Anderson-Darling tests, obtaining a p-value of 0.95 (i.e. both tests show that we cannot reject the null hypothesis that the distributions are drawn from a log-normal distribution). We have overplotted a log-normal distribution with the same mean and standard deviation to guide the eye. Additionally, for each pair of consecutive ΔΘ measurements, we performed a Monte Carlo resampling within the corresponding uncertainties (10 000 realisations) to assess whether the uncertainties are underestimated, which would affect our variability estimates. This procedure yielded a log-normal distribution centred at |ΔΘ/Δt|=2.09° d−1 with a standard deviation σ = 4.28° d−1, consistent with the observed distribution. To show the rate of occurrence and the magnitude of Θ variability in our sample, we also display the maximum absolute amplitude of the Θ variation for each source in Fig. 2.
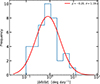 |
Fig. 1. Histogram of the rate of change of the polarisation angle per day for the sources in the sample. Non-detections are not considered in this calculation, as Θ is undefined in such cases. In red, a log-normal distribution defined in base e with the same central value (μ) and dispersion (σ) of the data is overplotted. |
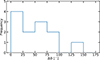 |
Fig. 2. Maximum Θ excursion per source in 25° bins. Non-detections are omitted, as Θ is undefined in such cases. |
Most objects are variable, some with small-amplitude variabilities (ΔΘ ≲ 25°) and some with large-amplitude variations (ΔΘ ≳ 90°). We present plots of Θ as a function of time from the peak (reported in Table 1 for each source) for TDEs and BFFs in Figs. 3 and 4, respectively. Alternatively, we consider the variability of Θ as a function of fallback time (t0) as in Koljonen et al. (2025) in Appendix B. However, expressing time in units of t0 does not reveal a common trend.
TDE peak times.
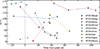 |
Fig. 3. Θ as a function of days since optical peak for the TDEs in the sample. Non-detections are omitted, as Θ is undefined in such cases. |
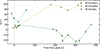 |
Fig. 4. Θ as a function of days since optical peak for the BFF subsample. Non-detections are omitted, as Θ is undefined in such cases. |
Additionally, similarly to Floris et al. (2025), we studied the rate occurrence of variability in our sample. Of the eight sources for which we detect significant variability between two consecutive observations, three of them (AT2019dsg, AT2020zso, and AT2023lli) show minimum variability timescales comparable to the minimum observational gap, indicating that denser sampling could reveal faster changes in some TDEs. High-S/N observations (e.g. with VLT for AT2020zso) enable the detection of significant but relatively small-amplitude variations on short (approximately weekly) timescales. AT2020zso falls in the 0–25° bin of Fig. 2.
3.1. TDE behaviour
From our analysis, we see that, even in the case of limited observations, there is significant variation in Θ in the majority of the TDEs in our sample. The main exceptions are AT2021blz and AT2024gre: the former likely because only two observations spanning ∼11 days were available, the latter because the observations span only ∼9 days. Nevertheless, both cases are broadly consistent with both reprocessing models (which predict no changes in Θ over short timescales; Metzger & Stone 2016; Leloudas et al. 2022) and with the shock model that predicts changes in Θ after t > t0 (Piran et al. 2015; Liodakis et al. 2023). By contrast, AT2024pvu exhibits an overall amplitude of ∼135° from the first observation (obtained a few days before the peak) and the last two observations (∼45d later). Such large continuous smooth rotations of the polarisation angle have so far only been observed in blazar jets (e.g. Blinov et al. 2018; Liodakis et al. 2020). The source displays a steady rotation at a rate of ∼3°d−1. Several other TDEs show qualitatively similar, though smaller, variations. Overall, we find that most TDEs exhibit variability in Θ, which in several cases diminishes with time as Θ approaches an approximately constant value (e.g. AT2020mot and AT2023clx). This inference is necessarily limited by the cadence and duration of the available monitoring: for sources such as AT2020zso or AT2024pvu, additional late-time observations could have revealed whether a similar settling behaviour occurs after the final epochs in our dataset.
3.2. Bowen fluorescence flare behaviour
As mentioned in Sect. 2, in this work we studied three BFFs. AT2022fpx and AT2020afhd are also considered TDEs (Perez-Fournon et al. 2022; Koljonen et al. 2024; Hammerstein et al. 2024), while AT2019aalc is considered to be associated with a nuclear transient and possibly coupled with a pre-existing active galactic nucleus disc (Śniegowska et al. 2025; Jordana-Mitjans et al. 2025); this likely gives rise to at least part of the observed variability. We show in Fig. 4 that, similarly to the TDEs in our sample, the BFFs exhibit variability in Θ. BFFs, which typically change more slowly than TDEs, tend to have later-time detections, which enables a better sampling of their Θ evolution. AT2022fpx displays an initial gradual decrease followed by a rapid increase, after which the polarisation degree becomes consistent with 0% within the errors (Koljonen et al. 2025). AT2019aalc and AT2020afhd exhibit sharp changes on approximately weekly timescales at late times; AT2020afhd maintains a quasi-constant Θ of ∼15° early on and transitions to a distinct value (∼100°) after a ∼6-month gap. Figure 4 suggests that the BFFs AT2019aalc and AT2022fpx undergo changes in the direction of Θ rotation over the course of the flare, whereas none of the classical TDEs in our sample shows comparable behaviour. However, given the small number of objects in the TDE and BFF subsamples, we cannot draw robust conclusions about the physical origin of these changes.
4. Discussion
Figure 2 demonstrates that Θ variability is common in our sample, with some TDEs showing small (< 25°) and others very large (≳ 90°) excursions over the observed duration. We identified several phenomenological patterns and predict how to identify them in the future:
-
Stochastic or chaotic changes in Θ: The shock-powered framework (Piran et al. 2015; Shiokawa et al. 2015) naturally accommodates irregular Π and Θ changes as the location, orientation, and strength of the tidal shocks evolve. This behaviour is consistent with the late-time variability of AT2019aalc and with the joint Π-Θ evolution observed in AT2020mot, AT2022fpx, and AT2023clx (Liodakis et al. 2023; Koljonen et al. 2024, 2025). The Θ changes seen in AT2019dsg, AT2023lli, and AT2024pvu can likewise be attributed to this scenario.
-
Near-constant Θ: In cases with little evolution (e.g. AT2024gre and AT2021blz, even though these results are biased because of the very short time span of the observations), simple axisymmetric reprocessing remains viable; modest deviations could reflect second-order asymmetries (Leloudas et al. 2022).
-
Opacity and obscuration changes: AT2020afhd appears to transition between distinct Θ states after ∼6 months. This may indicate a change from an optically thick to an optically thin reprocessing layer or a modification of the shock geometry as the debris circularises, potentially accompanied by the emergence of accretion-disc emission. A hybrid scenario with both shocks and reprocessing layers (e.g. Charalampopoulos et al. 2023) could also reproduce such behaviour. Concomitant spectral changes (e.g. the emergence of He IIλ4686 once the gas becomes optically thin) and/or the appearance or strengthening of X-rays would be expected; in AT2020afhd, stronger late-time X-rays are indeed present (Floris et al. 2025). A related possibility is suggested by the X-ray behaviour of AT2022fpx: during the X-ray flare, the optical polarisation was < 0.5% (Koljonen et al. 2024), likely due to a combination of lower luminosity and the depolarised nature of accretion disc emission. Had the S/N been higher, contemporaneous Θ variations analogous to those observed in AT2020afhd might have been measurable.
-
Polar-equatorial emission switch: The ∼90° change in Θ during the evolution of AT2020afhd may indicate a transition between polar and equatorial scattering regions, as predicted for active galactic nuclei (Marin 2017; Marin & Hutsemékers 2020).
-
Periodicity: Within our sample, Θ does not show signs of periodicity. Nevertheless, two main instances predict periodic changes in Π and Θ. Accretion disc precession has been invoked to explain the observed X-ray behaviour of TDE AT2020ocn (Pasham et al. 2024), and it is expected to also manifest in periodic changes in polarisation when the orbital plane of the disrupted star and the spin axis of the black hole are misaligned (Teboul & Metzger 2023; Koljonen et al. 2024). Another interesting possibility is a TDE occurring in a SMBH binary system (Lopez et al. 2019), which can likewise produce periodic variations in both Π and Θ (Dotti et al. 2022; Marin et al. 2023).
Overall, the observations are difficult to reconcile with purely axisymmetric, static reprocessing. Non-axisymmetric and time-dependent geometries (shock- or wind-driven), together with evolving optical depth, provide a more natural explanation and offer testable predictions.
5. Conclusions
In this work we analysed all currently available optical polarimetric datasets with at least two significant polarisation angle measurements from the literature and from the BOOTES campaign (Floris et al. 2025). We draw several key conclusions:
-
Overall Θ variability (ΔΘ > 25°) is observed in 8 out of 12 sources. The 4 sources with a constant Θ have been observed only over a short time span (e.g. AT2024gre, 9 days).
-
The distribution of |ΔΘ/Δt| peaks near ∼2° d−1.
-
Based on an exclusion criterion, we find that simple axisymmetric reprocessing cannot explain the ensemble. Models invoking shocks, evolving optical depth or geometry, and/or multiple polarising components better reproduce the observed phenomenology.
-
BFFs tend to exhibit sustained late-time Θ evolution. This is likely due in part to their slower fading, which in turn is due to their systematically longer decay times allowing for higher-S/N measurements to be taken over a longer period of time.
-
Denser polarimetric monitoring, contemporaneous spectroscopy, and X-ray/UV coverage are needed to discriminate among models.
-
These results demonstrate the need for predictive, time-dependent polarimetric modelling (including radiative-transfer and polarisation simulations) that can reproduce Θ(t) and be directly tested against current and future observations.
Acknowledgments
AF, IL, AP and BAG were funded by the European Union ERC-2022-STG – BOOTES – 101076343. Views and opinions expressed are however those of the author(s) only and do not necessarily reflect those of the European Union or the European Research Council Executive Agency. DB acknowledges support from the European Research Council (ERC) under the Horizon ERC Grants 2021 programme under grant agreement No. 101040021. KIIK has received funding from the European Research Council (ERC) under the European Union’s Horizon 2020 research and innovation programme (grant agreement No. 101002352, PI: M. Linares). Neither the European Union nor the granting authority can be held responsible for them. The IAA-CSIC co-authors acknowledge financial support from the Spanish “Ministerio de Ciencia e Innovación” (MCIN/AEI/ 10.13039/501100011033) through the Center of Excellence Severo Ochoa award for the Instituto de Astrofísica de Andalucía-CSIC (CEX2021-001131-S), and through grants PID2019-107847RB-C44 and PID2022-139117NB-C44. The data in this study include observations made with the Nordic Optical Telescope, owned in collaboration by the University of Turku and Aarhus University, and operated jointly by Aarhus University, the University of Turku and the University of Oslo, representing Denmark, Finland and Norway, the University of Iceland and Stockholm University at the Observatorio del Roque de los Muchachos, La Palma, Spain, of the Instituto de Astrofisica de Canarias. The data presented here were obtained in part with ALFOSC, which is provided by the Instituto de Astrofísica de Andalucía (IAA) under a joint agreement with the University of Copenhagen and NOT. Some of the data are based on observations collected at the Observatorio de Sierra Nevada; which is owned and operated by the Instituto de Astrofísica de Andalucía (IAA-CSIC). Based in part on observations collected at the Centro Astronómico Hispano en Andalucía (CAHA) at Calar Alto, operated jointly by Junta de Andalucía and Consejo Superior de Investigaciones Científicas (IAA-CSIC). This research is based in part on observations collected at the European Southern Observatory under ESO programme 106.214S.001. We acknowledge funding to support our NOT observations from the Finnish Centre for Astronomy with ESO (FINCA), University of Turku, Finland (Academy of Finland grant nr 306531). E.L. was supported by Academy of Finland projects 317636 and 320045. This research has made use of data from the RoboPol programme, a collaboration between Caltech, the University of Crete, IA-FORTH, IUCAA, the MPIfR, and the Nicolaus Copernicus University, which was conducted at Skinakas Observatory in Crete, Greece.
References
- Agudo, I., Thum, C., Ramakrishnan, V., et al. 2018, MNRAS, 473, 1850 [Google Scholar]
- Alexander, K. D., Margutti, R., Gomez, S., et al. 2025, ArXiv e-prints [arXiv:2506.12729] [Google Scholar]
- Antonucci, R. R. J. 1982, Nature, 299, 605 [NASA ADS] [CrossRef] [Google Scholar]
- Blagorodnova, N., Cenko, S. B., Kulkarni, S. R., et al. 2019, ApJ, 873, 92 [NASA ADS] [CrossRef] [Google Scholar]
- Blinov, D., Pavlidou, V., Papadakis, I., et al. 2015, MNRAS, 453, 1669 [NASA ADS] [CrossRef] [Google Scholar]
- Blinov, D., Pavlidou, V., Papadakis, I., et al. 2016, MNRAS, 462, 1775 [Google Scholar]
- Blinov, D., Pavlidou, V., Papadakis, I., et al. 2018, MNRAS, 474, 1296 [CrossRef] [Google Scholar]
- Charalampopoulos, P., Bulla, M., Bonnerot, C., & Leloudas, G. 2023, A&A, 670, A150 [NASA ADS] [CrossRef] [EDP Sciences] [Google Scholar]
- Cikota, A., Leloudas, G., Bulla, M., et al. 2023, ApJ, 943, L18 [Google Scholar]
- Dai, L., McKinney, J. C., Roth, N., Ramirez-Ruiz, E., & Miller, M. C. 2018, ApJ, 859, L20 [Google Scholar]
- Dotti, M., Bonetti, M., D’Orazio, D. J., Haiman, Z., & Ho, L. C. 2022, MNRAS, 509, 212 [Google Scholar]
- Earl, N., French, K. D., Ramirez-Ruiz, E., et al. 2025, ApJ, 983, 28 [Google Scholar]
- Floris, A., Liodakis, I., Koljonen, K. I. I., et al. 2025, A&A, 703, A81 [NASA ADS] [CrossRef] [EDP Sciences] [Google Scholar]
- Gaskell, C. M., Goosmann, R. W., Merkulova, N. I., Shakhovskoy, N. M., & Shoji, M. 2012, ApJ, 749, 148 [Google Scholar]
- Guolo, M., Gezari, S., Yao, Y., et al. 2024, ApJ, 966, 160 [NASA ADS] [CrossRef] [Google Scholar]
- Hammerstein, E., Chornock, R., Gezari, S., & Yao, Y. 2024, Transient Name Server AstroNote, 37, 1 [Google Scholar]
- Hills, J. G. 1975, Nature, 254, 295 [Google Scholar]
- Hovatta, T., Lindfors, E., Blinov, D., et al. 2016, A&A, 596, A78 [NASA ADS] [CrossRef] [EDP Sciences] [Google Scholar]
- Hutsemékers, D., Agís González, B., Sluse, D., Ramos Almeida, C., & Acosta Pulido, J.-A. 2017, A&A, 604, L3 [NASA ADS] [CrossRef] [EDP Sciences] [Google Scholar]
- Jordana-Mitjans, N., Franckowiak, A., Ramírez-Ruiz, E., et al. 2025, A&A, 704, A250 [NASA ADS] [CrossRef] [EDP Sciences] [Google Scholar]
- Kajava, J. J. E., Giustini, M., Saxton, R. D., & Miniutti, G. 2020, A&A, 639, A100 [NASA ADS] [CrossRef] [EDP Sciences] [Google Scholar]
- Kiehlmann, S., Savolainen, T., Jorstad, S. G., et al. 2016, A&A, 590, A10 [NASA ADS] [CrossRef] [EDP Sciences] [Google Scholar]
- Koljonen, K. I. I., Liodakis, I., Lindfors, E., et al. 2024, MNRAS, 532, 112 [Google Scholar]
- Koljonen, K. I. I., Nilsson, K., Liodakis, I., & Lindfors, E. 2025, MNRAS, 542, 2238 [Google Scholar]
- Komossa, S. 2015, J. High Energy Astrophys., 7, 148 [Google Scholar]
- Lee, C.-H., Hung, T., Matheson, T., et al. 2020, ApJ, 892, L1 [NASA ADS] [CrossRef] [Google Scholar]
- Leloudas, G., Dai, L., Arcavi, I., et al. 2019, ApJ, 887, 218 [NASA ADS] [CrossRef] [Google Scholar]
- Leloudas, G., Bulla, M., Cikota, A., et al. 2022, Nat. Astron., 6, 1193 [NASA ADS] [CrossRef] [Google Scholar]
- Liodakis, I., Blinov, D., Jorstad, S. G., et al. 2020, ApJ, 902, 61 [NASA ADS] [CrossRef] [Google Scholar]
- Liodakis, I., Koljonen, K. I. I., Blinov, D., et al. 2023, Science, 380, 656 [Google Scholar]
- Lopez, M., Jr, Batta, A., Ramirez-Ruiz, E., Martinez, I., & Samsing, J. 2019, ApJ, 877, 56 [NASA ADS] [CrossRef] [Google Scholar]
- Marin, F. 2017, A&A, 607, A40 [NASA ADS] [CrossRef] [EDP Sciences] [Google Scholar]
- Marin, F., & Hutsemékers, D. 2020, A&A, 636, A23 [NASA ADS] [CrossRef] [EDP Sciences] [Google Scholar]
- Marin, F., Hutsemékers, D., Liodakis, I., et al. 2023, A&A, 673, A126 [NASA ADS] [CrossRef] [EDP Sciences] [Google Scholar]
- Marin, F., Marinucci, A., Laurenti, M., et al. 2024, A&A, 689, A238 [NASA ADS] [CrossRef] [EDP Sciences] [Google Scholar]
- Metzger, B. D., & Stone, N. C. 2016, MNRAS, 461, 948 [NASA ADS] [CrossRef] [Google Scholar]
- Mockler, B., Guillochon, J., & Ramirez-Ruiz, E. 2019, ApJ, 872, 151 [Google Scholar]
- Pasham, D. R., Zajaček, M., Nixon, C. J., et al. 2024, Nature, 630, 325 [NASA ADS] [CrossRef] [Google Scholar]
- Perez-Fournon, I., Poidevin, F., Angel, C. J., et al. 2022, Transient Name Server Classification Report, 2022–1771, 1 [Google Scholar]
- Piran, T., Svirski, G., Krolik, J., Cheng, R. M., & Shiokawa, H. 2015, ApJ, 806, 164 [Google Scholar]
- Planck Collaboration VI. 2020, A&A, 641, A6 [NASA ADS] [CrossRef] [EDP Sciences] [Google Scholar]
- Rees, M. J. 1988, Nature, 333, 523 [Google Scholar]
- Reig, P., & Blinov, D. 2018, A&A, 619, A19 [NASA ADS] [CrossRef] [EDP Sciences] [Google Scholar]
- Reynolds, T. M., Thomsen, L., Mattila, S., et al. 2026, A&A, in press, https://doi.org/10.1051/0004-6361/202556056 [Google Scholar]
- Ryu, T., Krolik, J., & Piran, T. 2020, ApJ, 904, 73 [NASA ADS] [CrossRef] [Google Scholar]
- Shahbaz, T., Russell, D. M., Covino, S., et al. 2016, MNRAS, 463, 1822 [Google Scholar]
- Shiokawa, H., Krolik, J. H., Cheng, R. M., Piran, T., & Noble, S. C. 2015, ApJ, 804, 85 [Google Scholar]
- Śniegowska, M., Trakhtenbrot, B., Makrygianni, L., et al. 2025, ApJ, 989, 173 [Google Scholar]
- Taverna, R., Turolla, R., Muleri, F., et al. 2022, Science, 378, 646 [NASA ADS] [CrossRef] [Google Scholar]
- Teboul, O., & Metzger, B. D. 2023, ApJ, 957, L9 [Google Scholar]
- Trakhtenbrot, B., Arcavi, I., Ricci, C., et al. 2019, Nat. Astron., 3, 242 [Google Scholar]
- Uno, K., Maeda, K., Nagao, T., et al. 2025, ApJ, 986, L23 [Google Scholar]
- Wichern, H. C. I., Leloudas, G., Pursiainen, M., et al. 2026, A&A, 705, A250 [NASA ADS] [CrossRef] [EDP Sciences] [Google Scholar]
- Wiersema, K., Curran, P. A., Krühler, T., et al. 2012a, MNRAS, 426, 2 [NASA ADS] [CrossRef] [Google Scholar]
- Wiersema, K., van der Horst, A. J., Levan, A. J., et al. 2012b, MNRAS, 421, 1942 [NASA ADS] [CrossRef] [Google Scholar]
- Wiersema, K., Higgins, A. B., Levan, A. J., et al. 2020, MNRAS, 491, 1771 [NASA ADS] [CrossRef] [Google Scholar]
Appendix A: New observations
In this section we present the results from the polarimetric observations of the TDEs employed in this work in Table A.1, as discussed in Sect. 2.
New polarisation observations and re-analysed archival data.
Appendix B: Fallback time estimates
In this section we estimate the fallback time (t0), described as the timescale over which around 50% of the gas from the tidal disruption is expelled or accreted on the SMBH, based on two different models. In the reprocessing picture we use the black hole mass (MBH) and the disrupted stellar mass (M*) inferred with MOSFiT (Mockler et al. 2019) and adopt Eq. (5) of Metzger & Stone (2016):
 (B.1)
(B.1)
where M•, 6 is the MBH in units of 106M⊙. In the shock-powered emission scenario, t0 is instead estimated from (Ryu et al. 2020; Koljonen et al. 2025) as
 (B.2)
(B.2)
with the correction factor Ξ accounting for stellar structure and relativistic effects (Ryu et al. 2020):
![Mathematical equation: $$ \begin{aligned} \Xi = \frac{0.62 + \exp [(M_*-0.67)/0.21]}{1+0.55\exp [(M_*-0.67)/0.21]} \left(1.27 - 0.3 M_{\bullet ,6}^{0.242}\right). \end{aligned} $$](/articles/aa/full_html/2026/03/aa57658-25/aa57658-25-eq3.gif) (B.3)
(B.3)
We adopted the MBH and M* values from Floris et al. (2025) where available; for sources not included there, we applied the same methodology. In the case of AT2023clx, due to the combination of measured blackbody temperature (Tbb) and bolometric luminosity (Lbol) associated with the event, no solution could be found within the allowed parameter range. As a consequence, we assumed the MBH and M* adopted in Koljonen et al. (2025): MBH = 106M⊙, M* = 0.1M⊙. The mass estimates adopted in this work, together with the estimated t0 values, are reported in Table B.1.
TDEmass and MOSFit mass results.
We display the Θ variations over time for the simple TDEs according to the t0 from the MBH and M* results obtained adopting the TDEMass shock model (Fig. B.1) and the results from the MOSFiT reprocessing model (Fig. B.2). We also display the same for the BFFs alone in Figs. B.3 and B.4. We report that no systematic trend was found among the objects in our sample when adopting the t0 time frame, as clearly shown from the figures below.
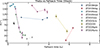 |
Fig. B.1. Θ measurements of the sources in the sample, as a function of t0, estimated based on the shock model (Ryu et al. 2020). Non-detections are omitted, as Θ is undefined in such cases. |
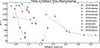 |
Fig. B.2. Θ measurements of the sources in the sample, as a function of t0, estimated based on the reprocessing model (Mockler et al. 2019). Non-detections are omitted, as Θ is undefined in such cases. |
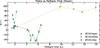 |
Fig. B.3. Θ measurements of the sources in the sample, as a function of t0, estimated based on the shock model (Ryu et al. 2020). Non-detections are omitted, as Θ is undefined in such cases. |
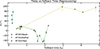 |
Fig. B.4. Θ measurements of the sources in the sample, as a function of t0, estimated based on the reprocessing model (Mockler et al. 2019). Non-detections are omitted, as Θ is undefined in such cases. |
All Tables
All Figures
|
Fig. 1. Histogram of the rate of change of the polarisation angle per day for the sources in the sample. Non-detections are not considered in this calculation, as Θ is undefined in such cases. In red, a log-normal distribution defined in base e with the same central value (μ) and dispersion (σ) of the data is overplotted. |
| In the text | |
|
Fig. 2. Maximum Θ excursion per source in 25° bins. Non-detections are omitted, as Θ is undefined in such cases. |
| In the text | |
|
Fig. 3. Θ as a function of days since optical peak for the TDEs in the sample. Non-detections are omitted, as Θ is undefined in such cases. |
| In the text | |
|
Fig. 4. Θ as a function of days since optical peak for the BFF subsample. Non-detections are omitted, as Θ is undefined in such cases. |
| In the text | |
|
Fig. B.1. Θ measurements of the sources in the sample, as a function of t0, estimated based on the shock model (Ryu et al. 2020). Non-detections are omitted, as Θ is undefined in such cases. |
| In the text | |
|
Fig. B.2. Θ measurements of the sources in the sample, as a function of t0, estimated based on the reprocessing model (Mockler et al. 2019). Non-detections are omitted, as Θ is undefined in such cases. |
| In the text | |
|
Fig. B.3. Θ measurements of the sources in the sample, as a function of t0, estimated based on the shock model (Ryu et al. 2020). Non-detections are omitted, as Θ is undefined in such cases. |
| In the text | |
|
Fig. B.4. Θ measurements of the sources in the sample, as a function of t0, estimated based on the reprocessing model (Mockler et al. 2019). Non-detections are omitted, as Θ is undefined in such cases. |
| In the text | |
Current usage metrics show cumulative count of Article Views (full-text article views including HTML views, PDF and ePub downloads, according to the available data) and Abstracts Views on Vision4Press platform.
Data correspond to usage on the plateform after 2015. The current usage metrics is available 48-96 hours after online publication and is updated daily on week days.
Initial download of the metrics may take a while.