Fig. 11.
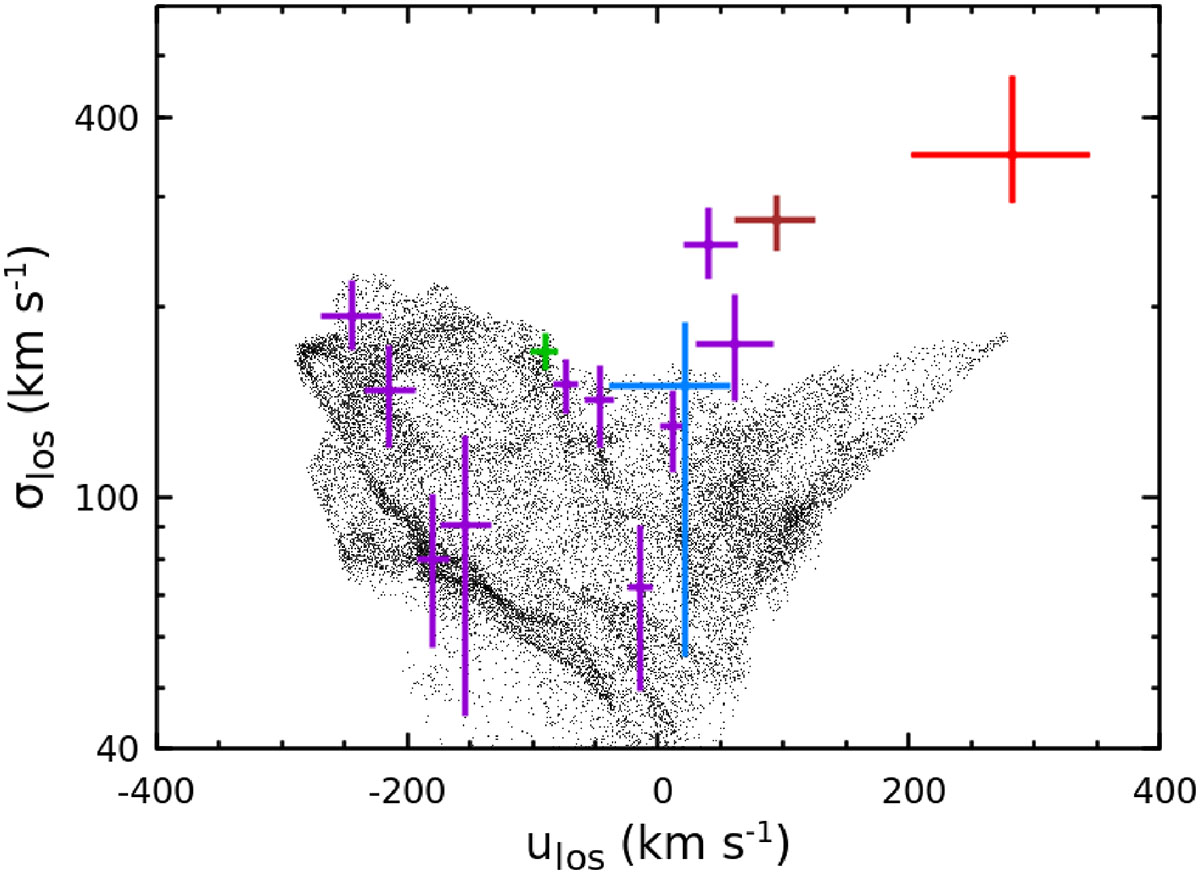
Download original image
Comparison of the LOS bulk velocity – velocity dispersion space distribution between XRISM observations and the simulation with (ξ0, P0) = (10, 2.5 Mpc) shown in the top panels of Fig. 10. Black dots mark measurements from a uniform grid within R = 400 kpc in the simulation. Observational data are the same as in Fig. 4, but only 1σ errors are shown. Our single-merger simulation reproduces the overall velocity pattern but fails to capture the high-velocity dispersions observed in certain outer regions of the cluster (see Sect. 5).
Current usage metrics show cumulative count of Article Views (full-text article views including HTML views, PDF and ePub downloads, according to the available data) and Abstracts Views on Vision4Press platform.
Data correspond to usage on the plateform after 2015. The current usage metrics is available 48-96 hours after online publication and is updated daily on week days.
Initial download of the metrics may take a while.