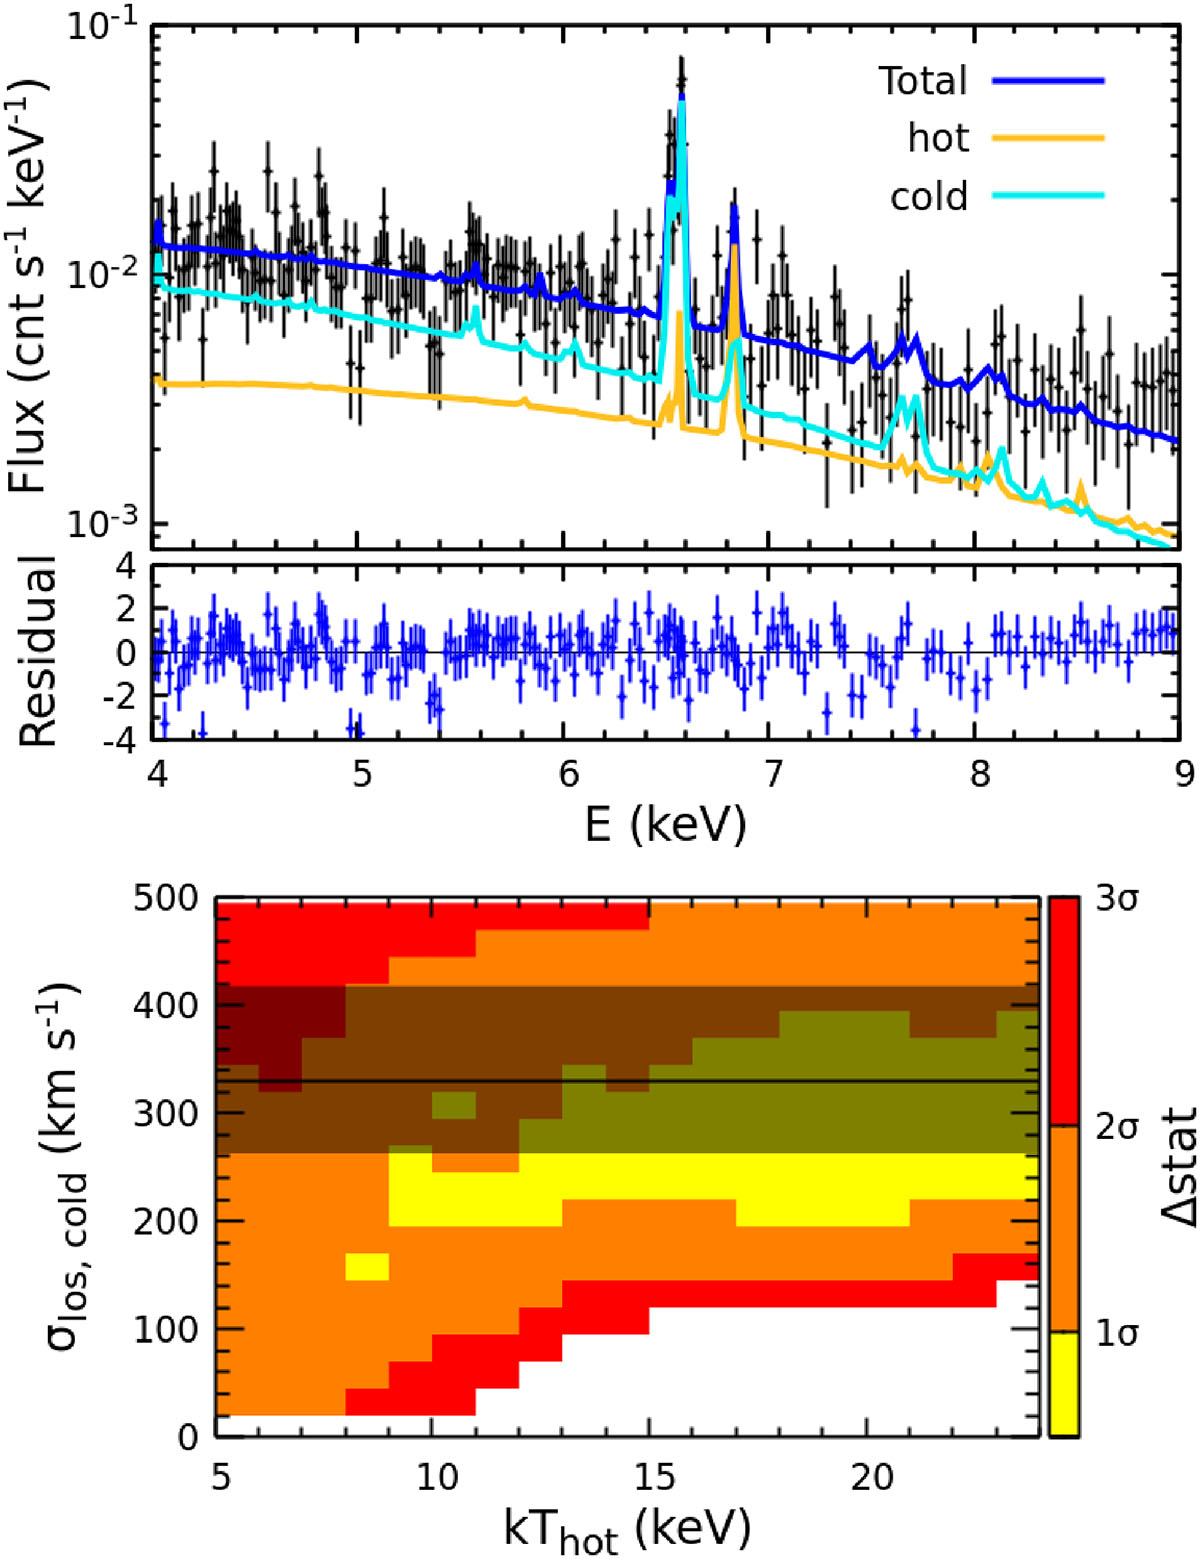
Fig. A.4.
Download original image
Top panels: Spectrum in the region E with the best-fit 2T model (blue). The cyan and yellow lines show its cold and hot ICM components, respectively. Bottom panel:Δ-statistic map in the 2D parameter space: the hot component’s temperature vs. the cold component’s velocity dispersion. The color indicates the 1, 2, and 3σ regions. The hot component cannot be tightly constrained in our fittings.
Current usage metrics show cumulative count of Article Views (full-text article views including HTML views, PDF and ePub downloads, according to the available data) and Abstracts Views on Vision4Press platform.
Data correspond to usage on the plateform after 2015. The current usage metrics is available 48-96 hours after online publication and is updated daily on week days.
Initial download of the metrics may take a while.