Fig. 3.
Download original image
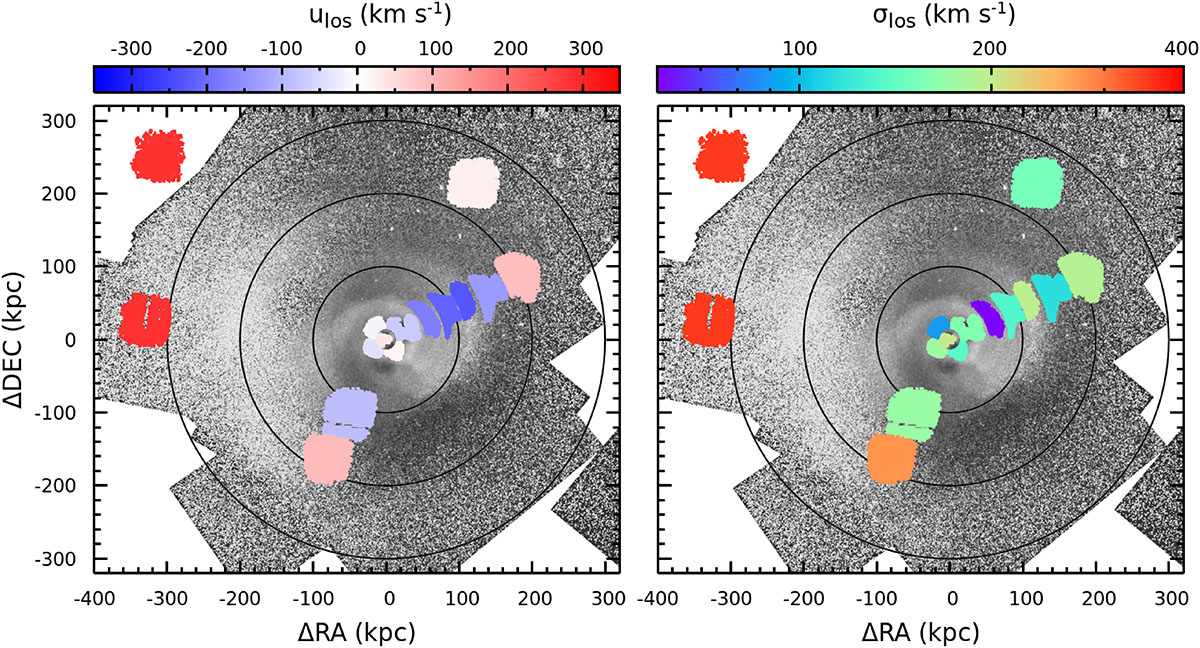
Best-fit gas bulk velocity (left) and velocity dispersion (right) maps of the Perseus cluster from nine XRISM/Resolve pointings. The maps are centered on the Perseus center (RA = 49.9507, Dec = 41.5117). The N and NE regions show the E+NE joint fitting result assuming a single temperature model. The color patches indicate the sky areas that contribute 50% of the photons for the corresponding sub-regions based on raytracing simulations. The measurement uncertainties are shown in Fig. 4. The Chandra X-ray residual is overlaid in the background highlighting the inner sloshing spiral and the eastern X-ray surface brightness excess, with black circles marking radii of 100, 200, and 300 kpc. The bulk velocity distribution, in the rest frame of the central ICM (zicm = 0.017628), shows an (asymmetric) dipole-like pattern, revealing a rotational motion of the ICM (see Sect. 3).
Current usage metrics show cumulative count of Article Views (full-text article views including HTML views, PDF and ePub downloads, according to the available data) and Abstracts Views on Vision4Press platform.
Data correspond to usage on the plateform after 2015. The current usage metrics is available 48-96 hours after online publication and is updated daily on week days.
Initial download of the metrics may take a while.