Fig. 4.
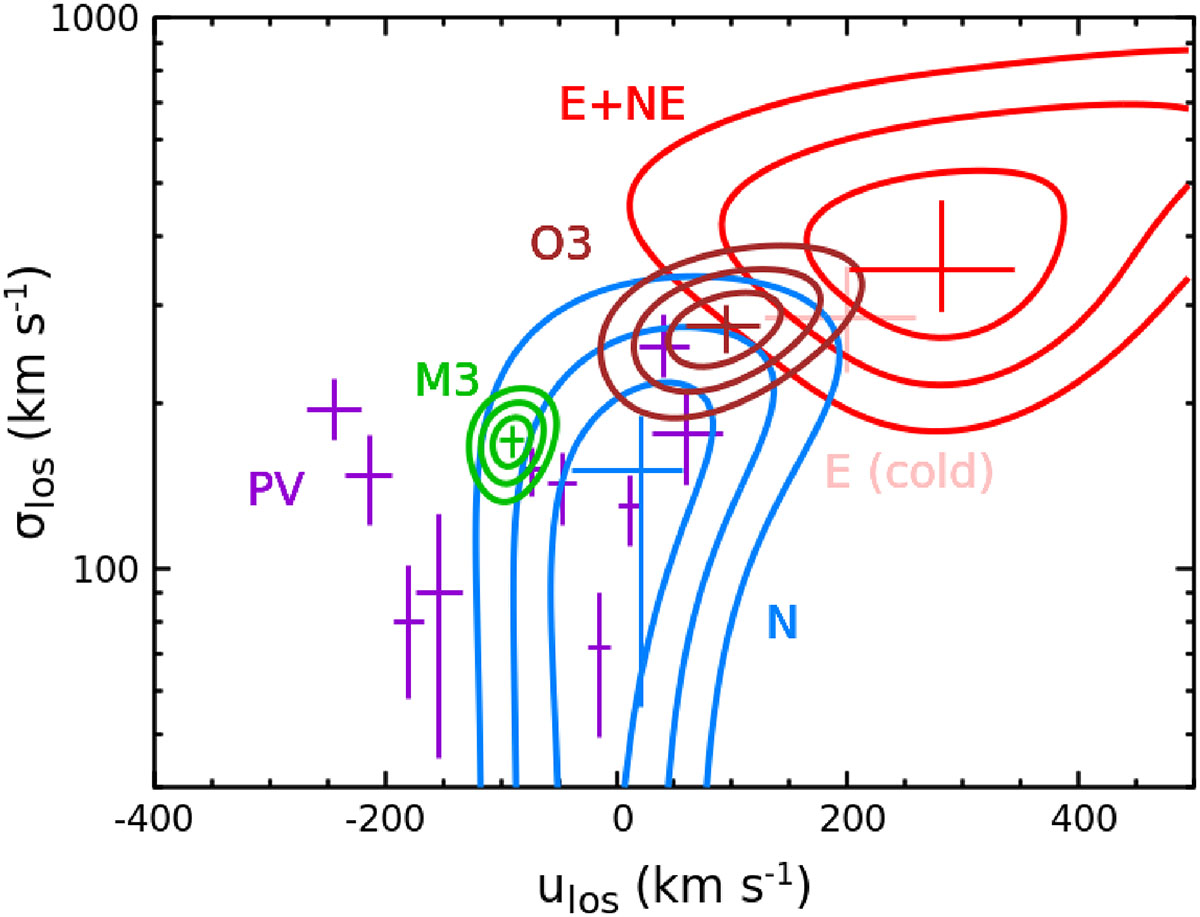
Download original image
2D confidence contours (1, 2, and 3σ) of the bulk velocity and velocity dispersion measurements of our new regions (calibration and GO pointings). The red contours indicate a joint fit between the E and NE regions (see Fig. A.3 for their individual fits). The crosses mark the best-fit parameters and their 1σ uncertainties, including also all PV data (ten sub-regions; see Sect. 3). The pink cross indicates the cold ICM component in the 2T model for region E (see Sect. 2).
Current usage metrics show cumulative count of Article Views (full-text article views including HTML views, PDF and ePub downloads, according to the available data) and Abstracts Views on Vision4Press platform.
Data correspond to usage on the plateform after 2015. The current usage metrics is available 48-96 hours after online publication and is updated daily on week days.
Initial download of the metrics may take a while.