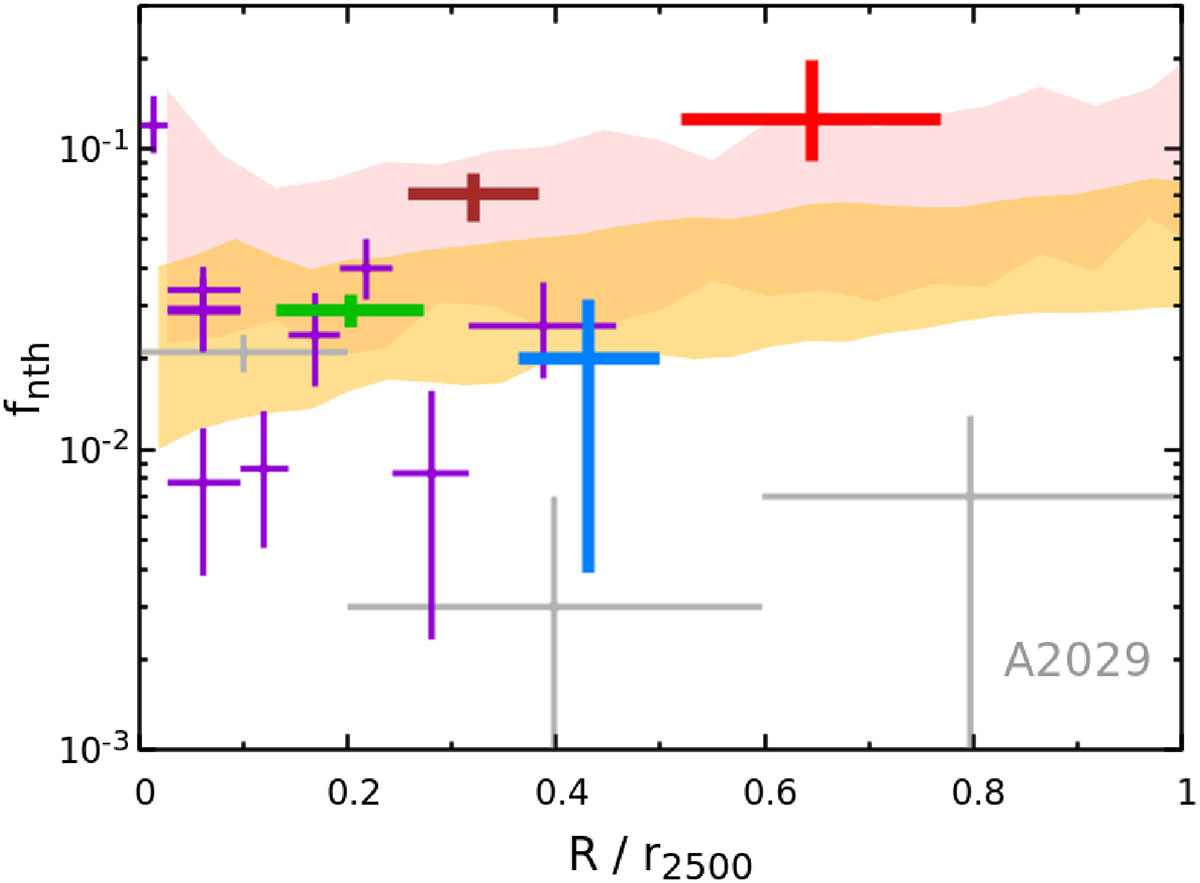
Fig. 5.
Download original image
Nonthermal pressure fraction profile of the Perseus cluster, compared with A2029 (grey points; XRISM Collaboration 2025b). Colors follow the same scheme as in Fig. 4 for Perseus. The shaded bands show numerical predictions from TNG cosmological simulations for two cluster subsamples: (i) the 31 most relaxed clusters from the TNG-300 simulation suite (yellow) and (ii) 30 Perseus-like massive, cool-core clusters from TNG-Cluster suite (pink). The bands represent the 10th-90th percentile range of the fnth distribution within each sample. The inner AGN-dominant region, as well as the regions overlapping the eastern X-ray surface brightness excess (E+NE and O3), show high fnth (> 7%; see Sect. 4.1).
Current usage metrics show cumulative count of Article Views (full-text article views including HTML views, PDF and ePub downloads, according to the available data) and Abstracts Views on Vision4Press platform.
Data correspond to usage on the plateform after 2015. The current usage metrics is available 48-96 hours after online publication and is updated daily on week days.
Initial download of the metrics may take a while.