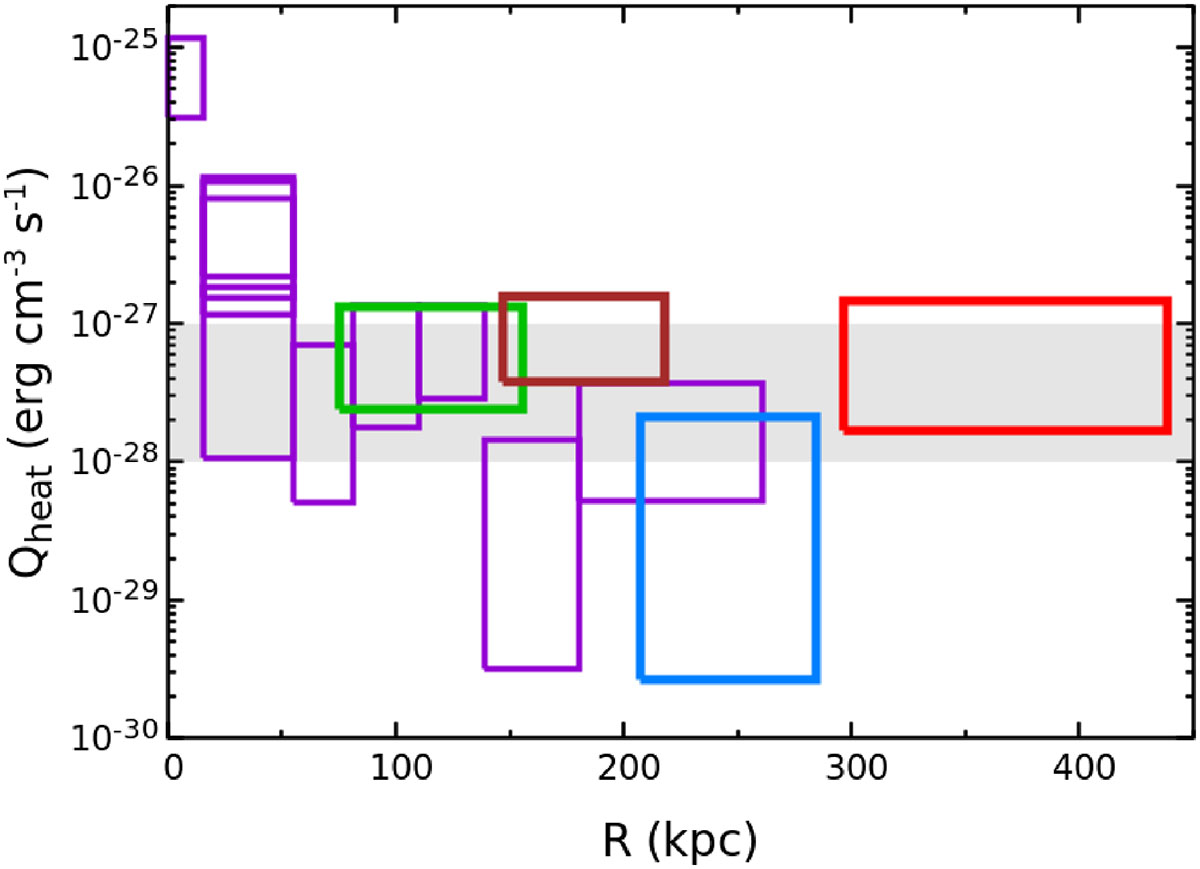
Fig. 8.
Download original image
Radial profile of the turbulent heating rate. The color scheme is the same as in Fig. 4. The uncertainties incorporate both the velocity statistical errors and effective length variations within each region. Outside the AGN-dominant region (i.e., ≳60 kpc), the heating rate appears approximately uniform (∼10−28 − 10−27 erg cm−3 s−1, marked by the grey band), covering a dynamical range of ℓeff ≃ 100 − 400 kpc (see Sect. 4.3).
Current usage metrics show cumulative count of Article Views (full-text article views including HTML views, PDF and ePub downloads, according to the available data) and Abstracts Views on Vision4Press platform.
Data correspond to usage on the plateform after 2015. The current usage metrics is available 48-96 hours after online publication and is updated daily on week days.
Initial download of the metrics may take a while.