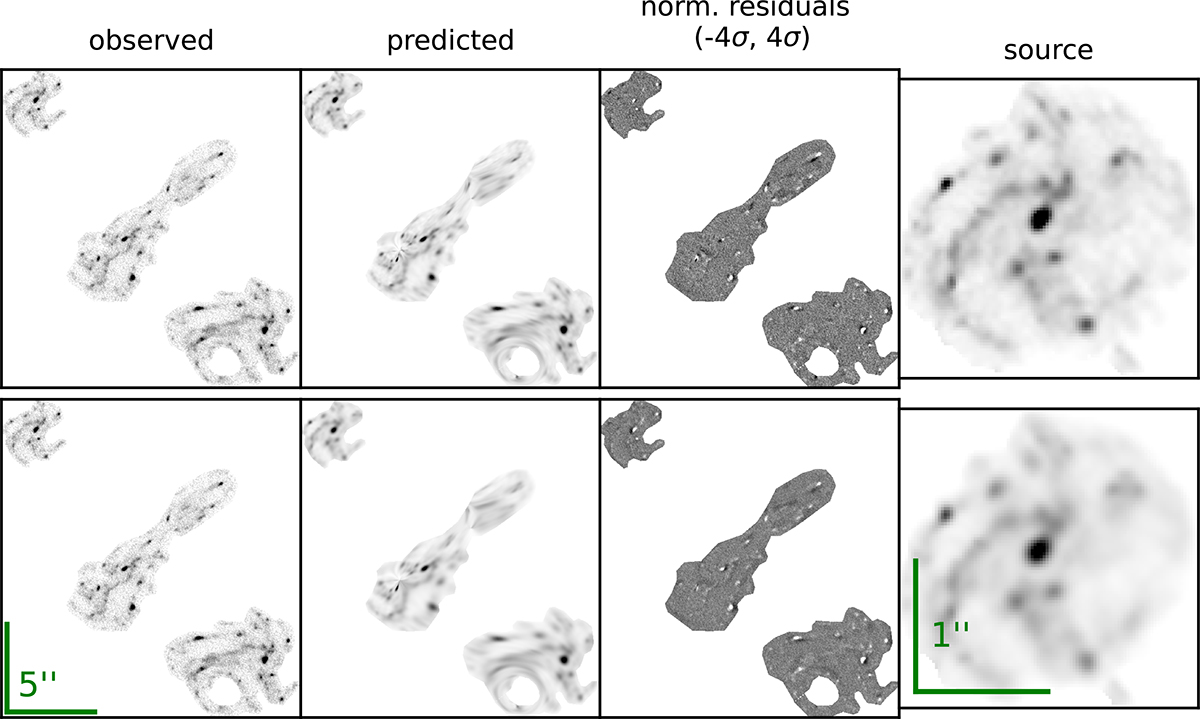
Fig. 2.
Download original image
Surface-brightness reconstruction from model Ew (top row), showing the best reconstruction, and from the point-like model S24 (bottom row), which was not optimized on the extended image. We show, from left to right, the observed image, the model-predicted image, the normalized residuals, and the reconstructed source (the SN host galaxy). We illustrate the sizes of the images and of the reconstructed sources with green bars of 5″and 1″, respectively. We again note that the Ew model is optimized with an approximate point spread function (see Sect. 2.3 for details), which slightly affects the final appearances of the reconstructed image and source.
Current usage metrics show cumulative count of Article Views (full-text article views including HTML views, PDF and ePub downloads, according to the available data) and Abstracts Views on Vision4Press platform.
Data correspond to usage on the plateform after 2015. The current usage metrics is available 48-96 hours after online publication and is updated daily on week days.
Initial download of the metrics may take a while.