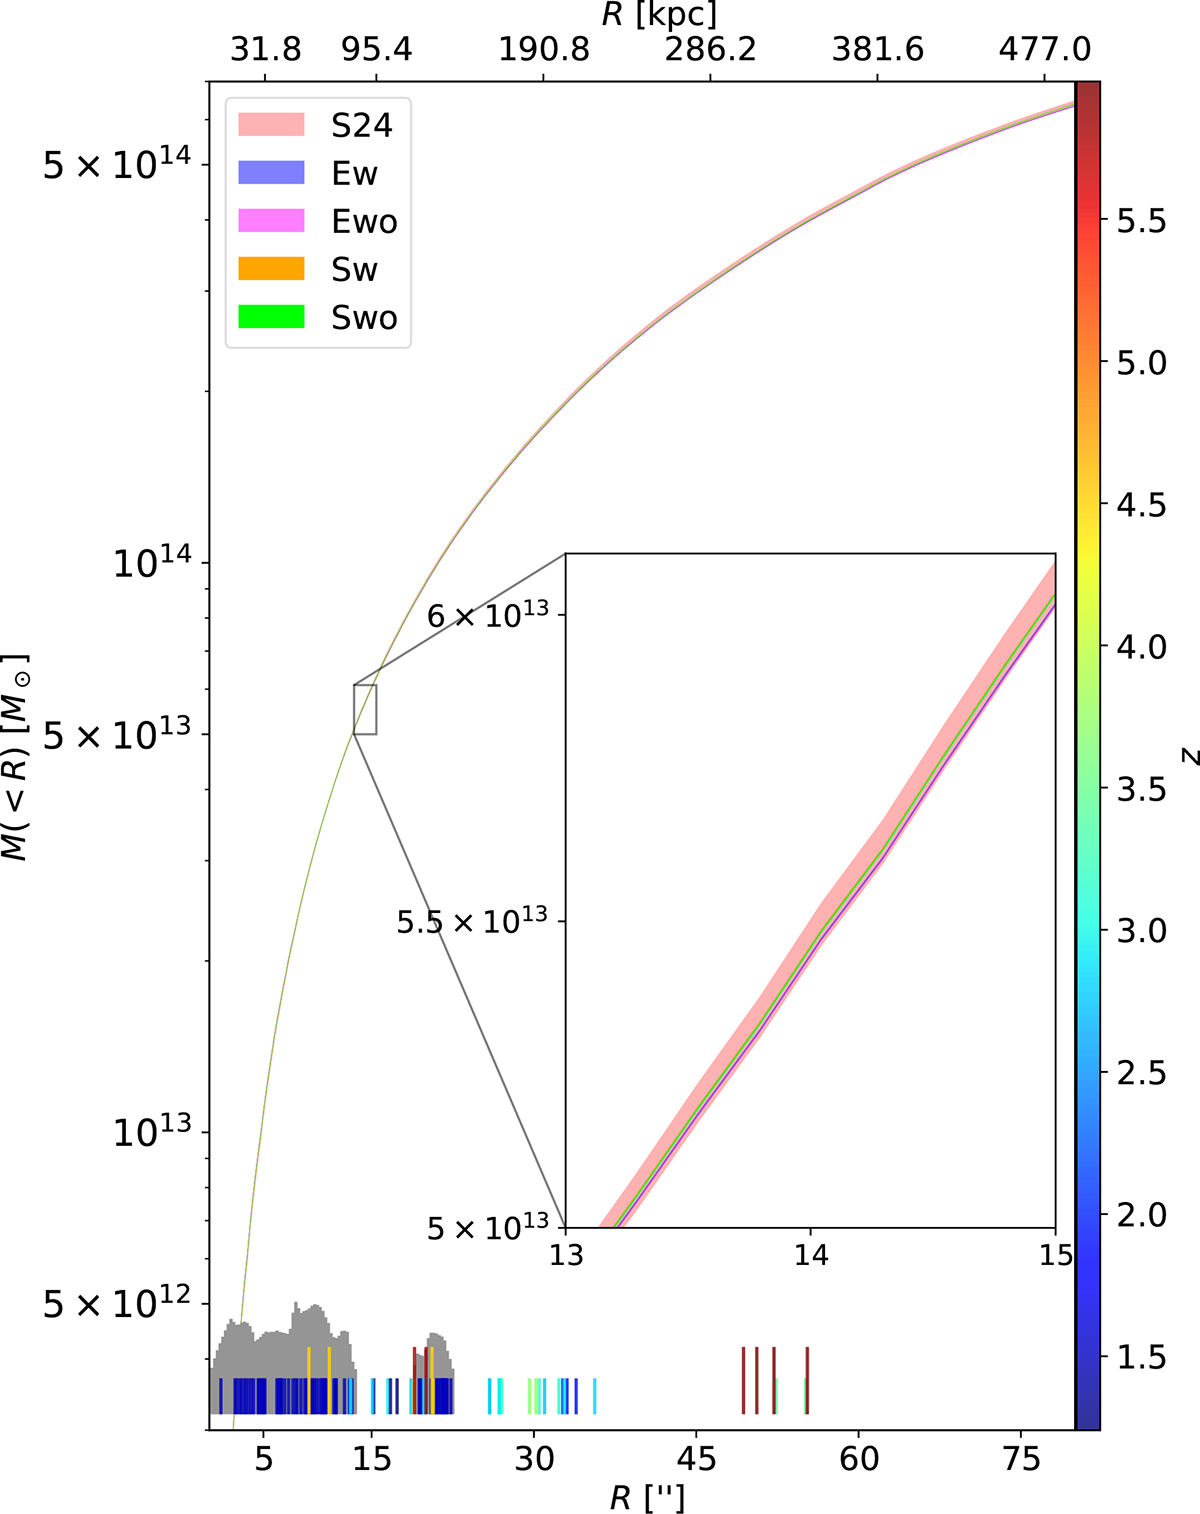
Fig. 5.
Download original image
Cumulative projected total mass profile M(< R) of MACS1149 as function of the radius, R, measured from the brightest cluster galaxy (see G16. The plotted bands correspond to the 1σ intervals obtained from 100 random iterations of the final sampling chains. We compared our four new extended image models with the point-like model from S24 and found significantly smaller statistical uncertainties for the extended image models. The positions of the multiple images are marked with small dashes on the lower x-axis and color-coded according to their redshifts. The bar lengths reflect the positional uncertainties (a small dash corresponds to an HST identification, while a long dash corresponds to a MUSE-only identification; see S24 for details). We further show the positions of the 77 000 HST image pixels used in the extended image models with a gray histogram, where the height (in log-scale) corresponds to the number of pixels per radial bin.
Current usage metrics show cumulative count of Article Views (full-text article views including HTML views, PDF and ePub downloads, according to the available data) and Abstracts Views on Vision4Press platform.
Data correspond to usage on the plateform after 2015. The current usage metrics is available 48-96 hours after online publication and is updated daily on week days.
Initial download of the metrics may take a while.