Fig. B.3.
Download original image
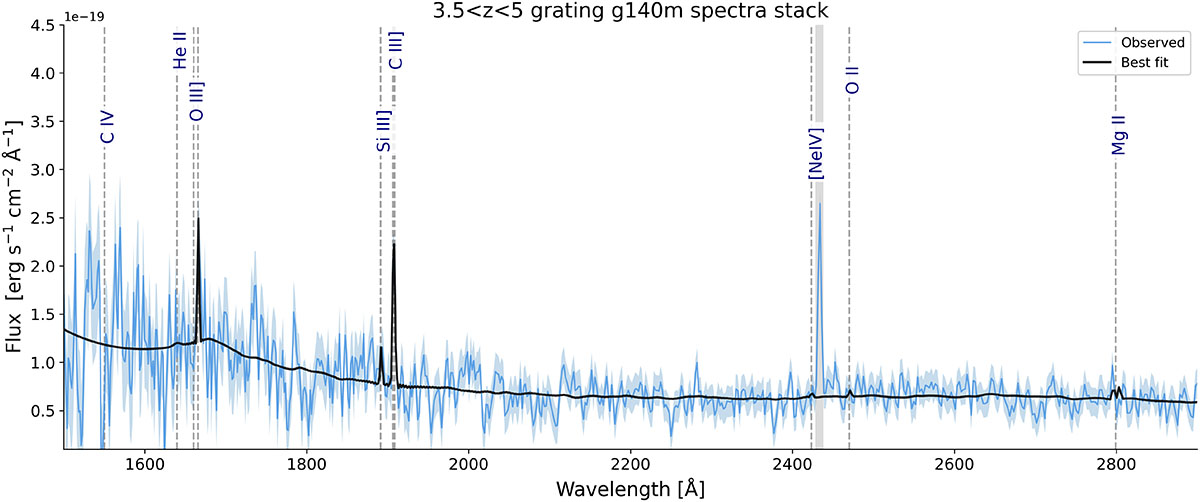
Stack of the rest-frame G140M grating spectra in the intermediate-redshift bin (3.5 < z < 5). Color coding as figures above. For visualization, the normalized stack was multiplied by the mean [OIII]λ5007 flux of the 11 contributing objects; this rescaling is used only for the figure and does not affect any measurements. The gray band masks a probable oversampling error, thus it has been removed from the fitting.
Current usage metrics show cumulative count of Article Views (full-text article views including HTML views, PDF and ePub downloads, according to the available data) and Abstracts Views on Vision4Press platform.
Data correspond to usage on the plateform after 2015. The current usage metrics is available 48-96 hours after online publication and is updated daily on week days.
Initial download of the metrics may take a while.