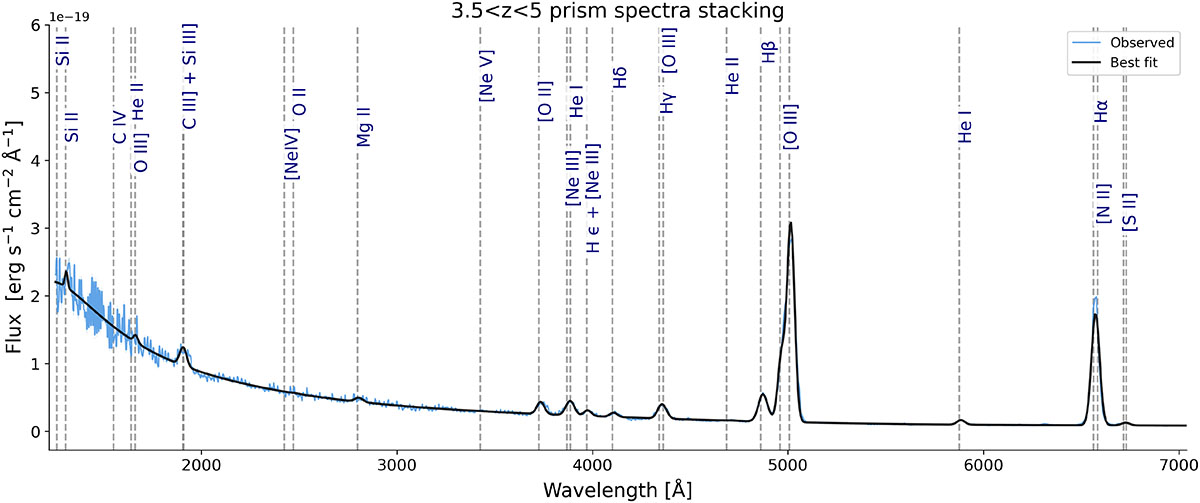
Fig. B.6.
Download original image
Stack of the rest-frame prism spectra in the intermediate-redshift bin (3.5 < z < 5). Color coding as figures above. For visualization purposes, the normalized stack has been multiplied by the mean [OIII]λ5007 flux of the 12 contributing objects. This rescaling affects only the plotted figure and not the underlying measurements.
Current usage metrics show cumulative count of Article Views (full-text article views including HTML views, PDF and ePub downloads, according to the available data) and Abstracts Views on Vision4Press platform.
Data correspond to usage on the plateform after 2015. The current usage metrics is available 48-96 hours after online publication and is updated daily on week days.
Initial download of the metrics may take a while.