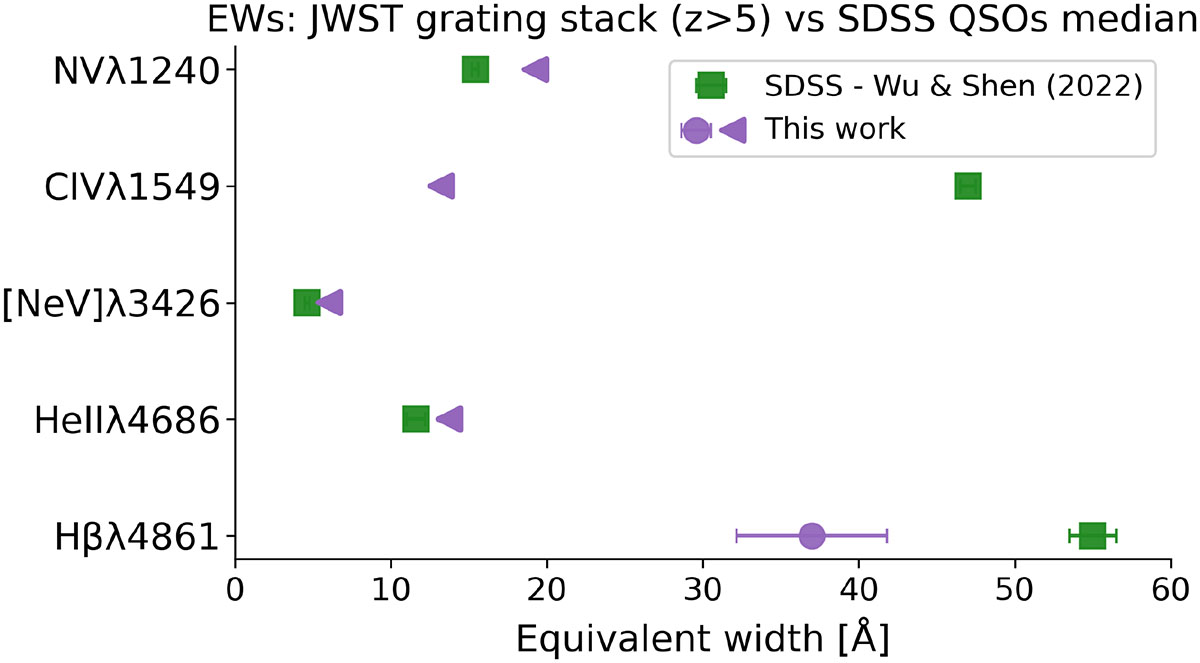
Fig. 3.
Download original image
Comparison of emission-line EWs in the JWST grating stack for the z > 5 sample (purple) with median values from the SDSS quasar catalog of Wu & Shen (2022) (green). Circles and squares represent measured lines with 1σ uncertainties, while left-pointing arrows denote 3σ upper limits for undetected lines in the JWST stack. Only the broad components are considered for C IV, He II, and Hβ. In most cases, error bars are smaller than the marker symbols and are not visually apparent.
Current usage metrics show cumulative count of Article Views (full-text article views including HTML views, PDF and ePub downloads, according to the available data) and Abstracts Views on Vision4Press platform.
Data correspond to usage on the plateform after 2015. The current usage metrics is available 48-96 hours after online publication and is updated daily on week days.
Initial download of the metrics may take a while.