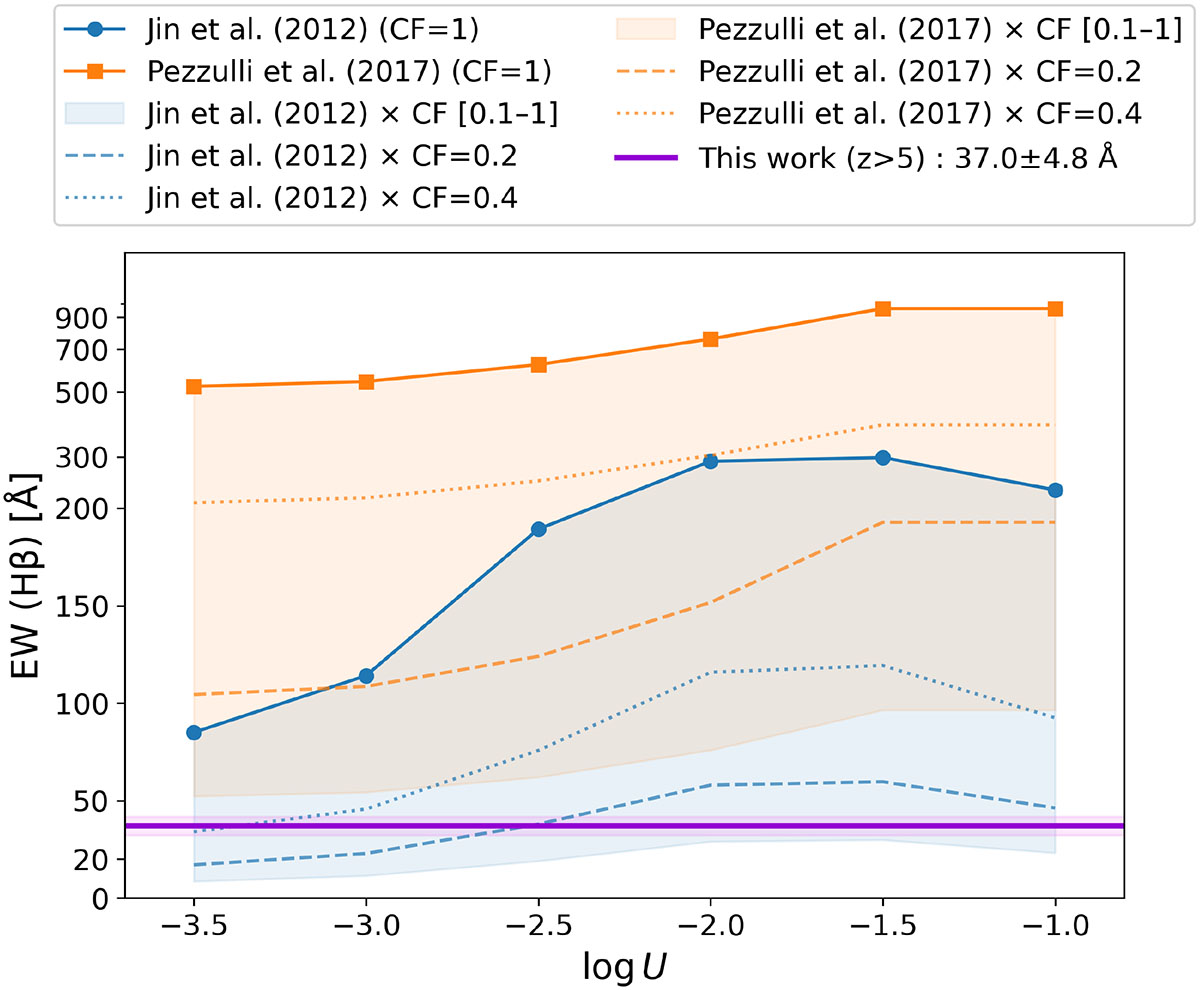
Fig. 5.
Download original image
Broad Hβ EWs as function of ionization parameter log U, derived from sub-Eddington CLOUDY models (parameters listed in Table 1). Different line styles indicate varying broad-line-region CFs, ranging from 1.0 to 0.1; models with the same SED share the same color. The shaded region for each SED represents the envelope spanned by CF values from 1.0 down to 0.1. The horizontal dark violet line marks the observed EW of broad Hβ measured in the z > 5 grating stack. The vertical axis uses a symlog scale (linear below 200 Å, logarithmic above).
Current usage metrics show cumulative count of Article Views (full-text article views including HTML views, PDF and ePub downloads, according to the available data) and Abstracts Views on Vision4Press platform.
Data correspond to usage on the plateform after 2015. The current usage metrics is available 48-96 hours after online publication and is updated daily on week days.
Initial download of the metrics may take a while.