Fig. 7.
Download original image
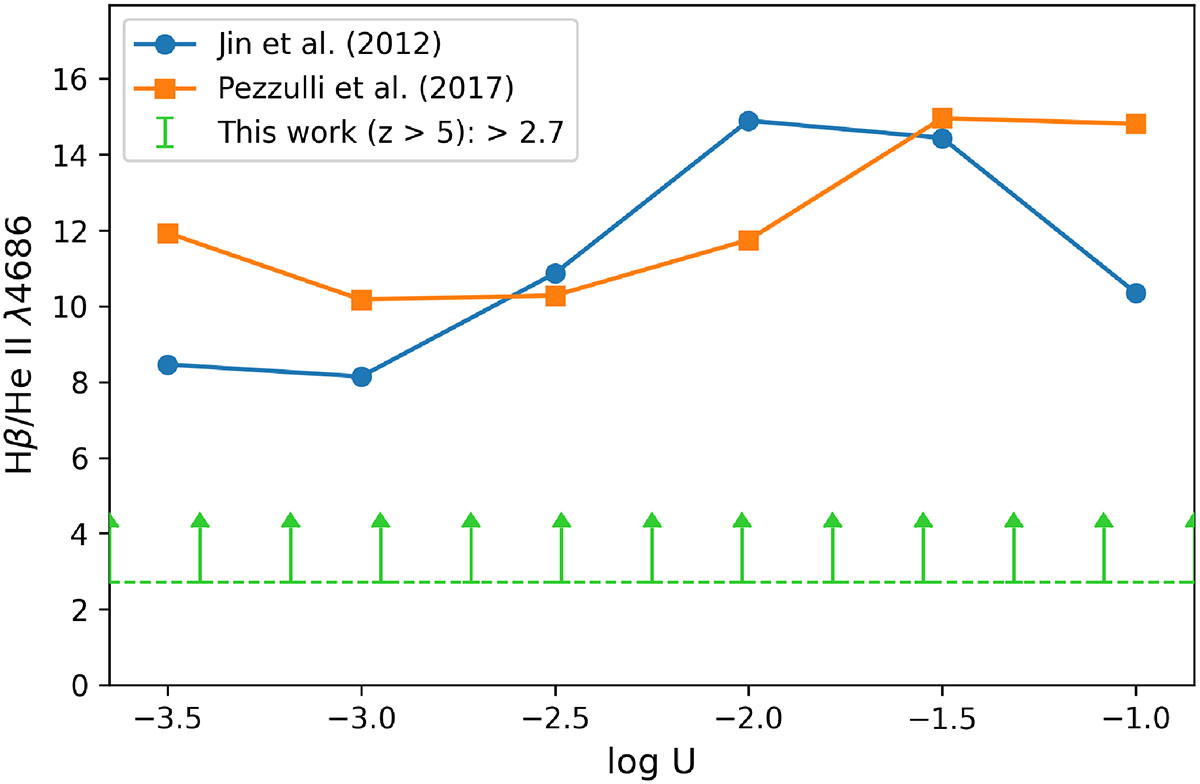
Predicted ratio of broad Hβ to HeII λ4686 emission as function of ionization parameter log U, based on the sub-Eddington CLOUDY models listed in Table 1. Blue and orange curves correspond to the Jin et al. (2012) and Pezzulli et al. (2017) SEDs, respectively. As the ratio is independent of the covering factor, only one curve is shown per SED. The upward-pointing green arrow marks the 3σ lower limit on the broad-line Hβ/HeII ratio measured in the z > 5 grating stack.
Current usage metrics show cumulative count of Article Views (full-text article views including HTML views, PDF and ePub downloads, according to the available data) and Abstracts Views on Vision4Press platform.
Data correspond to usage on the plateform after 2015. The current usage metrics is available 48-96 hours after online publication and is updated daily on week days.
Initial download of the metrics may take a while.