Fig. 8.
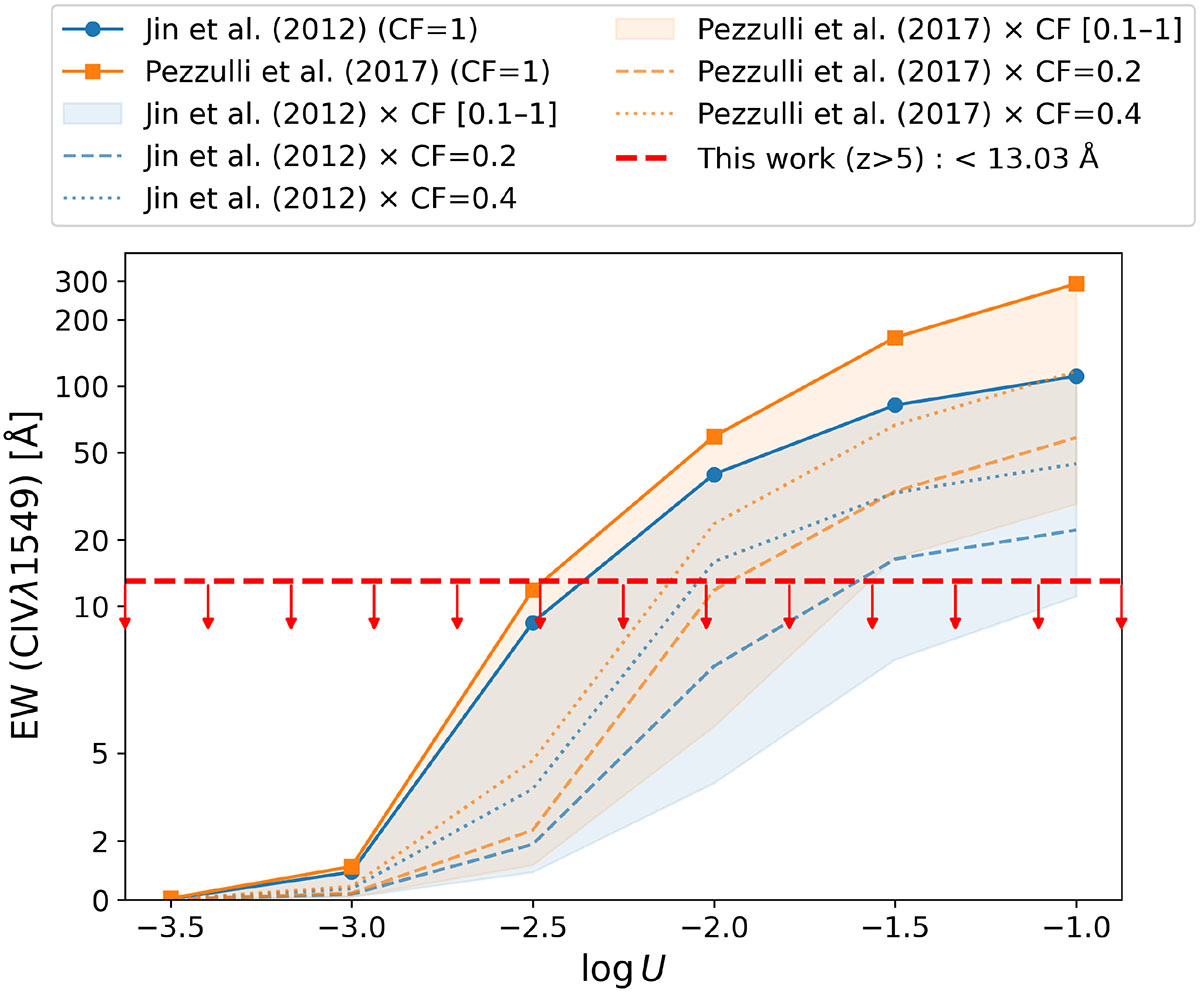
Download original image
Broad C IV λ1549 EWs versus ionization parameter log U from sub-Eddington CLOUDY models (parameters in Table 1). Line styles indicate different broad-line region CFs; colors distinguish SEDs. The downward-pointing red arrows mark the 3σ upper limit from the z > 5 grating stack. For consistency with our measurements, only the stronger CIV λ1549 component from CLOUDY is shown. The vertical axis uses a symlog scale (linear below 10 Å, logarithmic above).
Current usage metrics show cumulative count of Article Views (full-text article views including HTML views, PDF and ePub downloads, according to the available data) and Abstracts Views on Vision4Press platform.
Data correspond to usage on the plateform after 2015. The current usage metrics is available 48-96 hours after online publication and is updated daily on week days.
Initial download of the metrics may take a while.