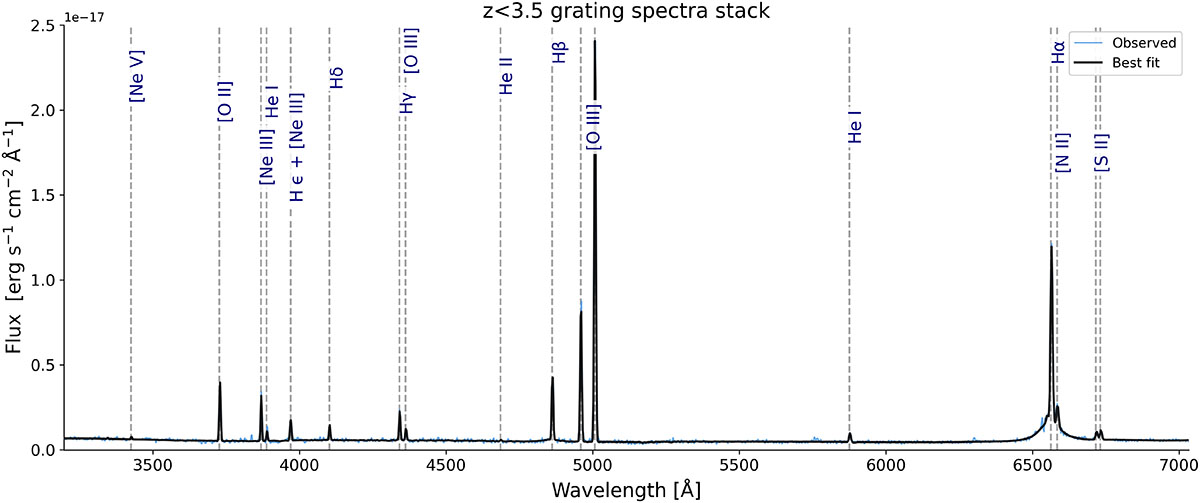
Fig. B.1.
Download original image
Stack of the rest-frame (G140M+G235M+G395M) grating spectra in the low-redshift bin (z < 3.5). The black line represents the best-fit from our pPXF fitting procedure, while the blue line shows the observed stacked spectrum. For visualization, the normalized stack was multiplied by the mean [OIII]λ5007 flux of the 5 contributing objects; this rescaling is used only for the figure and does not affect any measurements.
Current usage metrics show cumulative count of Article Views (full-text article views including HTML views, PDF and ePub downloads, according to the available data) and Abstracts Views on Vision4Press platform.
Data correspond to usage on the plateform after 2015. The current usage metrics is available 48-96 hours after online publication and is updated daily on week days.
Initial download of the metrics may take a while.