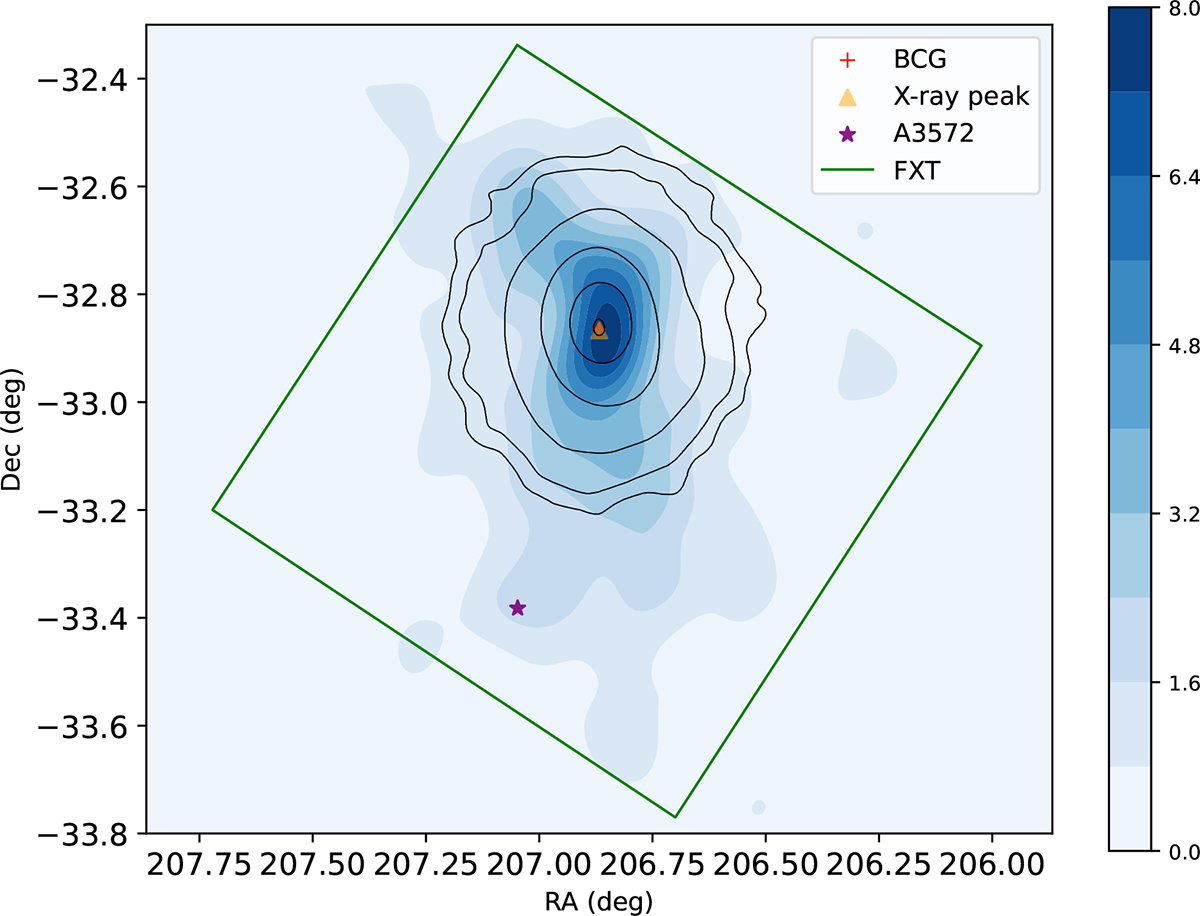
Fig. 2.
Download original image
Galaxy luminosity density map, generated from optical photometric data (galaxies with r-band magnitudes Rc < 22 and redshifts in the range 0.019–0.079), revealing a north–south extension. The red cross indicates the BCG, the yellow triangle marks the X-ray peak (RA = 206.86°, Dec = − 32.86°), the purple star shows the position of A3572, the green rectangles denote the FoV of EP-FXT, and the black contours show the X-ray isophotes.
Current usage metrics show cumulative count of Article Views (full-text article views including HTML views, PDF and ePub downloads, according to the available data) and Abstracts Views on Vision4Press platform.
Data correspond to usage on the plateform after 2015. The current usage metrics is available 48-96 hours after online publication and is updated daily on week days.
Initial download of the metrics may take a while.