| Issue |
A&A
Volume 707, March 2026
|
|
|---|---|---|
| Article Number | A182 | |
| Number of page(s) | 9 | |
| Section | Cosmology (including clusters of galaxies) | |
| DOI | https://doi.org/10.1051/0004-6361/202557688 | |
| Published online | 05 March 2026 | |
The X-ray properties and structure of A3571 up to R500
1
School of Physics and Astronomy, Beijing Normal University Beijing 100875, China
2
State Key Laboratory of Particle Astrophysics, Institute of High Energy Physics, Chinese Academy of Sciences Beijing 100049, China
3
Max Planck Institute for Extraterrestrial Physics Giessenbachstrasse 1 85748 Garching, Germany
4
Institute for Frontiers in Astronomy and Astrophysics, Beijing Normal University Beijing 102206, China
5
National Astronomical Observatories, Chinese Academy of Sciences 20A Datun Road Beijing 100101, China
6
Department of Astronomy, Xiamen University Xiamen 361005, China
7
School of Astronomy and Space Science, University of Chinese Academy of Sciences 19A Yuquan Road Beijing 100049, China
★ Corresponding authors: This email address is being protected from spambots. You need JavaScript enabled to view it.
; This email address is being protected from spambots. You need JavaScript enabled to view it.
Received:
14
October
2025
Accepted:
26
January
2026
Abstract
Abell 3571 is a nearby, X-ray-bright galaxy cluster located in the Shapley Supercluster. Although it appears morphologically relaxed in X-ray images, multiwavelength observations reveal subtle indications of residual dynamical activity likely associated with past merger events. Using wide-field (1° ×1°) data from the Einstein Probe Follow-up X-ray Telescope (EP-FXT), we extended measurements of the cluster’s properties beyond its R500 radius. We detect surface-brightness excesses on both the northern and southern sides, consistent with previous XMM-Newton results. The temperature, pressure, and entropy in the northern excess region are lower than the average values, whereas those on the southern side are slightly higher. However, we find no evidence of cold fronts or shocks. These features can be interpreted as sloshing motions triggered by an off-center minor merger. Our findings suggest that, despite its symmetric appearance, A3571 is still recovering from a minor merger and is currently in a post-merger phase. This work also demonstrates the excellent capability of EP-FXT for probing the outskirts of galaxy clusters.
Key words: galaxies: clusters: intracluster medium / galaxies: clusters: individual: Abell 3571
© The Authors 2026
 Open Access article, published by EDP Sciences, under the terms of the Creative Commons Attribution License (https://creativecommons.org/licenses/by/4.0), which permits unrestricted use, distribution, and reproduction in any medium, provided the original work is properly cited.
This article is published in open access under the Subscribe to Open model. This email address is being protected from spambots. You need JavaScript enabled to view it. to support open access publication.
1. Introduction
Galaxy clusters are the most massive gravitationally bound systems in the Universe. The majority of their baryonic matter exists in the form of a hot, diffuse intracluster medium (ICM), which emits strongly in the X-ray band (Kravtsov & Borgani 2012; Vikhlinin et al. 2014). Although many clusters appear to be approximately relaxed and in equilibrium in observations, their formation is fundamentally a highly dynamic process. Frequent merger events and continuous matter accretion produce pronounced dynamical effects in the ICM, driving significant departures from hydrostatic and thermal equilibrium (Markevitch & Vikhlinin 2007; Kravtsov & Borgani 2012; Rahaman et al. 2022; Liu et al. 2018). Understanding these disturbances is therefore essential for constraining the physical processes that shape the formation and evolution of galaxy clusters, as well as for providing key observational insights into the assembly of large-scale cosmic structures.
X-ray observations have revealed the characteristic signatures of such dynamical activity, confirming the widespread presence of nonequilibrium structures in galaxy clusters, among which shocks and cold fronts are the most representative. Shocks, typically generated by high-velocity mergers, heat the ICM on short timescales and appear in X-ray images as sharp, arc-shaped edges (Markevitch & Vikhlinin 2007). The Bullet Cluster (Koda et al. 2008; Markevitch et al. 2002) and Abell 3667 (Owers et al. 2009) provide two of the most striking examples. Cold fronts, by contrast, appear as contact discontinuities where denser but cooler gas is juxtaposed against hotter surroundings (Markevitch et al. 2000; Vikhlinin et al. 2001; Markevitch & Vikhlinin 2007). They are generally linked to the displacement of cool core gas induced by gravitational perturbations, such as those triggered by minor mergers (Ascasibar & Markevitch 2006; Roediger et al. 2011; ZuHone et al. 2010). In relaxed clusters, such perturbations can drive sloshing motions of the central gas, producing multiple cold fronts at different radii. Over time, these sloshing motions can evolve into intricate spiral structures, which are observed as concentric edges in X-ray images (Sonkamble et al. 2024; Kadam et al. 2024a,b). To date, spiral-like cold front structures have been identified in a number of well-studied clusters, including Abell 496 (Ghizzardi et al. 2014), Abell 795 (Kadam et al. 2024a), Perseus (Walker et al. 2017; Fabian et al. 2006a), and Virgo (Roediger et al. 2011; Zheng et al. 2025).
Abell 3571 (A3571) is a nearby rich galaxy cluster at redshift 0.039 (Rossetti & Molendi 2010), located in the Shapley Supercluster (Raychaudhury et al. 1991). The brightest cluster galaxy (BCG) of A3571 is MCG–05–33–002, which exhibits a pronounced north–south elongation extending over several hundred kiloparsecs (Kemp & Meaburn 1991). Although A3571 is classified as a relaxed cool-core cluster, Laganá (2019) found no evidence of a central temperature drop in its temperature map. In addition, Hudaverdi et al. (2005) reported a noticeable north–south temperature asymmetry, suggesting that A3571 recently experienced – or is still experiencing – dynamical evolution.
Early X-ray observations revealed that the ICM of A3571 exhibited an average temperature of  keV, based on EXOSAT1data (Edge et al. 1990), or 6.9 ± 0.2 keV, based on ASCA2 data (the radial temperature profile extends to 30′ at ASCA’s ∼ 3′ half-power diameter; Markevitch et al. 1998), with a central metal abundance reaching as high as 0.6 times the solar value at R < 0.5′ and declining to about 0.3 at a radius of 7′. XMM-Newton radial profiles further trace the temperature and metallicity distributions out to approximately 10′ (Hudaverdi et al. 2005). ROSAT3 imaging revealed a nearly spherical X-ray brightness distribution, with the intracluster gas appearing azimuthally symmetric and exhibiting only slight ellipticity (Nevalainen et al. 2000). Based on high-resolution observations from XMM-Newton, the central region of A3571 shows pronounced temperature and metallicity inhomogeneities, which appear as a patchy distribution. A temperature difference of up to 2 keV is detected between the northern and southern regions, suggesting that the cluster has undergone complex dynamical processes, such as the infall of subgroups (Hudaverdi et al. 2005).
Studies of A3571 not only examined the properties of the hot gas but also attempted to infer the gravitational mass and dark matter distribution within the cluster. Nevalainen et al. (2000) combined ASCA temperature data with ROSAT imaging data to estimated the total mass of the cluster to be approximately  with
with  Mpc at 90% confidence, which means the cluster is in hydrostatic equilibrium. Subsequently, Nevalainen et al. (2001) derived the total mass of A3571,
  , by combining the BeppoSAX and ASCA temperature profiles with a dark matter density model under the assumption of hydrostatic equilibrium. The corresponding gas mass fraction was estimated to be
  .
.
Although X-ray observations indicate that A3571 exhibits an overall spherically symmetric structure with a central cooling flow, multiwavelength data have revealed a more complex dynamical history. Early studies found that the spatial distribution of galaxies and the pronounced north–south elongation of the central cD galaxy are prominent characteristics (Kemp & Meaburn 1991), possibly suggesting that the cluster underwent merger or disturbance events. Subsequently, spectroscopic analyses revealed an asymmetric radial velocity distribution among member galaxies and identified multiple velocity substructures, further supporting an evolutionary scenario in which several smaller galaxy groups successively merged into the main cluster (Quintana & De Souza 1993). Venturi et al. (2002) conducted a radio analysis of the galaxy cluster complex consisting of A3571, A3572, and A3575, and concluded that the system is in a late merger stage, with its radio properties reflecting a relatively relaxed dynamical state. More recent multiwavelength observations have not detected large-scale radio halos or significant active galactic nucleus activity, indicating that A3571 is currently in a relatively relaxed, post-merger evolutionary stage.
Early multiwavelength observations suggest that A3571 is in a relatively relaxed, late post-merger stage. However, our understanding of its merger history remains limited, particularly regarding the hot gas in the outskirts. Therefore, we aim to conduct a more systematic and in-depth investigation of the gas distribution and merger state of A3571 using large field-of-view (FoV) X-ray imaging observations.
The Follow-up X-ray Telescope (FXT) is one of the key payloads aboard the Einstein Probe (EP) mission, which was launched on January 9, 2024 (Yuan et al. 2022, 2025). It features a FoV of approximately 1 square degree, an angular resolution of 9.6″ per pixel, and a half-power diameter spatial resolution of 22″, with an energy band of 0.3-10 keV. The EP-FXT also benefits from an exceptionally low particle background, making it well suited for detecting faint diffuse X-ray emission.
This paper is organized as follows: In Sect. 2 we describe the data used in our analysis. In Sect. 3 the analysis of the X-ray and optical observations is described. In Sect. 4 we discuss cluster dynamics and possible subclusters. We summarize our results in Sect. 5. We adopt H0 = (67.4 ± 0.5) km s−1 Mpc−1 and Ωm = 0.315 ± 0.007 (Planck Collaboration VI 2020), and the best-fit parameters from the spectral fitting are reported with 90% confidence intervals.
2. Observations and data reduction
2.1. X-ray data
During the performance verification phase of the EP mission, A3571 was observed with the EP-FXT in full-frame (FF) mode from March 30 to 31, 2024 (ObsID 11904194436), with the total effective exposure time of 40ks. The data reduction followed standard procedures using the FXT Data Analysis Software (FXTDAS, version 1.20)4 (Zhao et al. 2025), with additional support from general analysis tools provided by CIAO (version 4.16)5 and HEASoft (version 6.33.1)6.
We used the fxtchain pipeline to generate a series of calibrated event files for subsequent scientific analysis. To eliminate the effect of out-of-time events, which account for approximately 0.23% of the total detected events in the FF mode, simulated out-of-time event files were created using fxtootest and were subsequently subtracted from the original images using ftimgcalc. Since the particle background is uniformly distributed and not affected by the telescope’s vignetting function, it was removed before applying vignetting correction. The background spectrum was extracted from the storage area of the event file and modeled using fxtbkggen (Zhang et al. 2025), after which it was subtracted from the image. Vignetting, caused by the decrease in effective area at larger off-axis angles, leads to reduced photon flux at the edges of the FoV. To correct for this effect and improve the S/N, we used reproject_image from CIAO to co-align and merge the images and vignetting-corrected exposure maps from FXT-A and FXT-B. The merged images were then divided by the combined exposure map using farith to produce a vignetting-corrected image. After vignetting correction, point sources were identified using the wavdetect from CIAO and excluded to avoid contamination in the analysis of diffuse emission. Subsequently, the smooth were conducted with a 14.4″ σ Gaussian kernel. The final X-ray image in the 0.3–7.0 keV band is presented in Fig. 1.
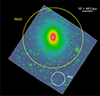 |
Fig. 1. Particle-background-subtracted, vignetting-corrected, and smoothed EP-FXT image of A3571 in the 0.3–7.0 keV energy band. The green circle is R500 (1.29 Mpc). |
To compare EP-FXT with XMM-Newton, we selected the European Photon Imaging Camera (EPIC) MOS1 observation of A3571 conducted by XMM-Newton in July 2002 (ObsID 0086950201, with an exposure time of 33 ks) and processed the data using the XMM-Newton Science Analysis System (SAS7) in FF mode. Time intervals affected by flares were removed by screening the high-energy light curve.
2.2. Optical data
The photometric catalog used in this study was derived from the Dark Energy Spectroscopic Instrument (DESI) Legacy Imaging Surveys Data Release 10 (Dey et al. 2019). We selected a 2.0° ×1.5° field encompassing the A3571 cluster and its surrounding region, spanning 205.87° < RA < 207.87° and −33.8° < Dec < −32.3°, with a magnitude limit of magr < 22. Cluster member candidates are identified using the red sequence method, by selecting galaxies within 3σ of the best-fit red sequence and further restricting their photometric redshifts to the range 0.019 ≤ z ≤ 0.079. This yields a sample of 399 galaxies.
To examine the spatial distribution of galaxies in and around A3571, we generated a smoothed luminosity density map based on this photometric sample. Following the method of Wen & Han (2013), the r-band luminosity of each galaxy was estimated using its redshift and apparent magnitude. These luminosities were then mapped onto a 200 × 200 grid covering the selected field, and a 2D Gaussian kernel with a full width of 3.5′ was applied to smooth the distribution.
The resulting luminosity density map is shown in Fig. 2. A prominent central peak (the yellow triangle) is evident, coinciding with the location of the BCG (marked by a red cross) very well. The galaxy distribution exhibits a mild elongation along the north–south direction. The EP-FXT field (represented by a green square) fully covers both the core and the extended outskirts of the cluster. The overlaid EP-FXT X-ray isophotes (shown as black lines) show a more relaxed morphology. Considering that the relaxation time of the gas is shorter than that of the galaxies, this means that this cluster might be a late-stage merger, where the gases has fully merged and the galaxies have not yet relaxed.
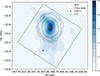 |
Fig. 2. Galaxy luminosity density map, generated from optical photometric data (galaxies with r-band magnitudes Rc < 22 and redshifts in the range 0.019–0.079), revealing a north–south extension. The red cross indicates the BCG, the yellow triangle marks the X-ray peak (RA = 206.86°, Dec = − 32.86°), the purple star shows the position of A3572, the green rectangles denote the FoV of EP-FXT, and the black contours show the X-ray isophotes. |
There is another galaxy cluster candidate, A3572, located about 30′ to the south of A3571. Struble & Rood (1999) estimated a redshift of 0.052 and a velocity dispersion of 1216 km s−1 based on six galaxies, while Lauer et al. (2014) reported a redshift of z ≈ 0.039 for an elliptical galaxy that is considered to be its BCG. Based on the photometric luminosity density map and the corresponding X-ray emission distribution, we do not detect any significant enhancement in galaxy number density or X-ray surface brightness at the reported location of A3572. This suggests that, if A3572 exists, it may host a very weak ICM or be a poor system that is not clearly detectable with the currently available photometric and X-ray data. Consequently, the nature of A3572 remains uncertain.
3. Analysis and results
The galaxy density distribution of A3571 shows a noticeable elongation along the north–south direction, suggesting that the cluster is not in a state of hydrostatic equilibrium. To investigate its thermodynamic properties and assess potential merger activity, we conducted a detailed imaging and spectral analysis of the ICM.
3.1. 1D analysis
3.1.1. The surface brightness profile
To comprehensively assess the background level of EP-FXT, we extracted the radial surface brightness profile of A3571, centered on its X-ray emission peak, and compared it with the corresponding profile obtained from XMM-Newton observations, as shown in Fig. 3.
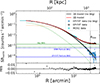 |
Fig. 3. Normalized surface brightness profiles measured with EP-FXT and XMM-Newton. The black points represent the EP-FXT data, and the solid red line shows the best-fit double-β model, including background components. The blue points correspond to the EP-FXT surface brightness after subtraction of both the particle and sky backgrounds, fitted with a double-β model without backgrounds. The best-fit curve is shown as the solid black line, while the dashed orange and green lines indicate the two individual components of this model. The cyan points are the XMM-Newton data. The horizontal solid blue and green lines denote the particle background from fxtbkggen and sky background levels for EP-FXT, respectively, while the horizontal dashed blue and green lines indicate the particle and sky background levels for XMM-Newton. |
Black points are the EP-FXT data, which extends out to approximately 40′. The horizontal blue line represents the EP-FXT particle background ∼(7.891 ± 0.016)×10−5 cts/s/arcmin2, generated using fxtbkggen as described by Zhang et al. (2022). The horizontal green line represents the EP-FXT sky background ∼1.29 × 10⁻³ cts/s/arcmin2, obtained by fitting a constant to the surface brightness in the 30′–40′ region of A3571, which nevertheless includes faint emission from the cluster. The blue points indicate the EP-FXT surface brightness after subtracting both background components. We employed a double-β model to fit the background-subtracted surface brightness profile. The model equation is
![Mathematical equation: $$ \begin{aligned} S(r)=A[1 + ( \frac{r}{r_{c1}})^2]^{-3\beta _1 + 0.5}+B[1 + ( \frac{r}{r_{c2}})^2]^{-3\beta _2 + 0.5} + C .\end{aligned} $$](/articles/aa/full_html/2026/03/aa57688-25/aa57688-25-eq6.gif) (1)
(1)
The best-fit parameters are listed in Table 1. Additionally, we plot in Fig. 3 the two components of the double-β model, which reveal the presence of a dense core in the central region of A3571.
Best-fit parameters of the double-β model with 1σ errors.
Similarly, we performed a radial analysis of the XMM-Newton MOS1 data and normalized its surface brightness profile to the maximum value of the EP-FXT data. The background components included the sky background obtained from blank-sky observations, and the particle background derived from the 10–12 keV spectrum. The dashed blue and green lines correspond to the normalized particle background of ∼(5.386 ± 0.092) × 10−4 cts/s/arcmin2 and the normalized sky background of ∼6.880 × 10⁻⁴ cts/s/arcmin2, respectively.
As shown in Fig. 3, the surface brightness profiles of EP-FXT and XMM-Newton are consistent. However, at a radius of around 10′, the XMM-Newton surface brightness profile appears slightly higher. This minor difference is likely attributable to increased background uncertainties and reduced effective exposure toward the edge of the XMM-Newton FoV. In addition, EP-FXT offers a much larger FoV, extending to approximately 40′. Additionally, the low particle background of EP-FXT provides an ideal condition to study diffuse sources. On the other hand, the sky background of EP-FXT is slightly higher than that of XMM-Newton, because it is estimated by fitting a constant to the surface brightness in the outer region of A3571, which still contains faint emission from the cluster. In contrast, the XMM-Newton background is based on blank-sky observations and is therefore free from cluster contamination.
3.1.2. Global spectral analysis
In the spectral analysis, we considered both the particle background and the sky background components. The particle background was generated using the fxtbkggen tool, while the sky background was extracted in a circle region beyond R500 (see the white circle in Fig. 1). The source spectrum was obtained from a circular region with a radius of 20′ centered on the X-ray peak (indicated by the red and blue points in Fig. 4). For background, we first subtracted the particle background–scaled to match the sky background region–from the spectrum of the background region shown in Fig. 1. The sky background was then rescaled to match the area of the source region. The sky background and background-subtracted source spectrum are shown as the purple and orange points in Fig. 4, respectively. Similarly, since the particle background generated by fxtbkggen covers the entire CCD, it also needed to be rescaled to match the area of the source region before subtraction. The particle background is shown as the green and brown points in Fig. 4.
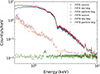 |
Fig. 4. Spectrum of A3571 extracted within a 20′ radius centered on the X-ray peak. The blue and red points represent the observational data from FXT-A and FXT-B, respectively. The green and brown points correspond to their particle backgrounds, and the orange and purple points represent the sky backgrounds after subtraction of the particle background. |
The particle background spectra of FXT-A and FXT-B exhibit similar shapes, remaining at a level of approximately 10−2 counts s−1 keV−1, which is well below the source emission. Three prominent instrumental lines are present: Al-Kα (∼1.48 keV), Fe-Kα (∼6.38 keV), and Cu-Kα (∼8.04 keV). Around ∼1 keV, where the source emission peaks, the particle background contributes less than 1% of the source count rate, thereby enabling more reliable analysis of faint diffuse sources. Below 1 keV, the FXT-B spectrum differs from that of FXT-A, primarily due to FXT-B’s larger effective area in this energy band. In addition, extended sources are influenced by atmospheric absorption at low energies because of the satellite’s low-Earth orbit. Therefore, we restricted our data processing and analysis to the 1.0–8.0 keV range.
3.1.3. The radial temperature profile
Thanks to the large FoV of EP-FXT, we were able to explore the outer ICM of A3571 efficiently. Centering on the X-ray peak, we used XSPEC (version 12.14.1) to extract spectra from 11 concentric annular regions (more than 20000 photons were detected in each region) in the 1.0–8.0 keV energy band and conducted a radial analysis. The ancillary response files were generated using the EP-FXT response tool fxtarfgen. The spectra were grouped using grppha with a minimum of 30 counts per bin to ensure the applicability of the χ2 statistic. The diffuse ICM thermal emission was modeled using the APEC (version 3.0.9), while Galactic hydrogen absorption was accounted for with the TBABS model. We adopted the solar abundance table from Asplund et al. (2009), with the redshift fixed at 0.039, the abundance fixed at 0.3 and the hydrogen column density fixed at 5.08 × 1020 cm−2 (Willingale et al. 2013). All other parameters were left free during the fit. The radial profiles are shown in Fig. 5. The black points represent the EP-FXT data in this work, respectively. The blue points indicate the XMM-Newton data, while the green points show the ASCA data from Hudaverdi et al. (2005).
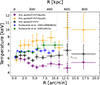 |
Fig. 5. Radial temperature profile of A3571. The black circles show the temperature distribution measured using EP-FXT in this study. The blue dots and green squares correspond to the XMM-Newton data and the ASCA data reported by Hudaverdi et al. (2005). The purple and yellow triangles indicate the temperature profile measured by EP-FXT in the southern and northern directions, respectively. The vertical dashed gray line indicates the location of R2500. |
In the central region (R < 1′), the EP-FXT temperature is consistent with the results of Hudaverdi et al. (2005) based on XMM-Newton and ASCA, thereby reinforcing the evidence for the presence of a cool core. Beyond the central region, the temperature profile is broadly consistent with an approximately isothermal distribution at ∼6 keV. A mild decrease in temperature is observed around R ∼ 5′, followed by a slight recovery at larger radii.
To further investigate the systematic deviation between temperature of EP-FXT and measurements from literature, we divided the region into northern (0° −180°) and southern (180° −360°) sectors with west as 0° and angles increasing clockwise. The corresponding temperature distributions are shown as the yellow and purple points in Fig. 5.
Although the azimuthally averaged temperatures measured by EP-FXT are overall lower than those obtained from XMM-Newton and ASCA, with a difference on the order of ∼1 keV, the temperature measured by EP-FXT in the southern region is higher than in the other two datasets. This behavior may reflect the presence of multiple temperature components within the cluster, to which different instruments respond differently, thereby leading to discrepancies in the derived temperatures; nevertheless, the overall temperature trends remain consistent.
Notably, the northern region also exhibits a clear temperature decline. This feature is associated with the brightness excess detected in the northern region and will be explored further in the following sections.
3.2. 2D analysis
3.2.1. The brightness residual image
To investigate the spatial structure of A3571, we used Sherpa version 4.16.08 to subtract an elliptical β-model, centered on the X-ray peak, together with a constant sky background (see Sect. 3.1.1), from Fig. 1. The best-fit parameters of the elliptical β model are listed in Table 2, and the residual map is shown in Fig. 6.
Best-fit parameters of the elliptical β model with 1σ uncertainties.
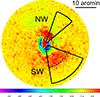 |
Fig. 6. Residual map of A3571. It was obtained by subtracting an elliptical β model with an added constant component from Fig. 1. The two sectors are regions of radial analysis in the subsequent sections. |
A distinct U-shaped surface brightness deficit is found south of the cluster center, whereas a fan-shaped brightness enhancement is detected to the north. Hudaverdi et al. (2005) reported similar features based on XMM-Newton observations. There is also a faint surface brightness enhancement in the southwestern. These features suggest that A3571 is not fully relaxed and still being disturbed.
3.2.2. Thermodynamic 2D maps
To enable high-resolution 2D mapping of the ICM thermodynamic properties, we performed an Voronoi tessellation on the X-ray image, growing regions to S/N ≥ 60 and refining them with S/N-weighted Lloyd iterations, yielding 102 adaptive bins. The spectrum extracted from each region was modeled with a TBABS * APEC model in 1.0–8.0 keV, with the same parameter settings described in Sect. 3.1.3. Based on the best-fitting temperature and normalization values, we derived pseudo-pressure and pseudo-entropy maps using P = kTne and  , respectively (Sasaki et al. 2016), ne is electron density and kT is temperature. Because the normalization obtained from spectral fitting is proportional to the square of the electron density, we express P ∝ kTnorm0.5 and S ∝ kTnorm−1/3 (see Fig. 7; Fabian et al. 2006b).
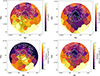 |
Fig. 7. Voronoi Tessellation method applied to partition A3571 and spectral fitting performed for each subregion in the 1.0–8.0 keV energy band. Top left: Temperature map. Top right: Temperature error map. Bottom left: Pseudo-pressure map. Bottom right: Pseudo-entropy map. Contours in different colors represent the different intensity levels in Fig. 6. |
The temperature map results indicate that the northern region is overall cooler than the southern region, a trend that is not only consistent with previous XMM-Newton studies (Hudaverdi et al. 2005) but also in agreement with the temperature profile shown in Fig. 5. In the overall cooler northern region, the fan-shaped structure shows an even lower temperature, which is consistent with the drop in temperature around 5′ in Fig. 5, supporting the interpretation that this decrease is driven by the fan-shaped structure. In addition, the surface brightness enhancement found in the southwest coincides with a region of higher temperature.
The pseudo-pressure map clearly indicates that the pressure is lower in the northern region and higher in the southern region. In contrast, the pressure distribution derived from XMM-Newton observations appears smooth, showing no prominent localized features, and declines steadily with radius in a similar manner along different azimuthal directions (Hudaverdi et al. 2005). This difference may arise from the different methodologies used to estimate temperature and density. In the case of Hudaverdi et al. (2005), the temperature was estimated from hardness ratios, and the electron density was inferred from the soft-band (0.8–1.6 keV) X-ray surface brightness. While this approach offers advantages in terms of computational efficiency, it may be less capable of resolving subtle structures in dynamically complex regions. In contrast, the EP-FXT analysis employs adaptive binning with a S/N of 60 for spectral fitting, yielding higher spatial resolution maps of temperature and normalization, which better reveal localized pressure features.
In the pseudo-entropy map, the northern region displays an overall low entropy distribution. A similar low-entropy feature was also identified by Hudaverdi et al. (2005). This indicates that the fan-shaped structure is the disturbed core of the cluster.
At the center, the U-shaped surface brightness deficit exhibits high temperatures and entropy, indicating that it is filled with hot, low-density gas–features reminiscent of X-ray cavities typically driven by active galactic nucleus feedback. However, A3571 lacks the characteristic radio emission commonly observed in such cavities (Venturi et al. 2002). This absence suggests that active galactic nucleus feedback is unlikely to be the dominant cause, and that alternative mechanisms–such as mergers or gas sloshing–offer a more plausible explanation for the origin of the U-shaped structure.
4. Discussion
Although the X-ray morphology of A3571 looks like relaxed, its residual map and 2D thermodynamic maps reveal disturbed structure in the inner region. Considering its galaxy density distribution is also elongated along the north–south direction. To identify possible merging signals, we selected two sectors covering the brightness excesses in the northwest and southwest for detailed analysis.
Figure 6 shows the sectors defined in the northwest and southwest directions, from which the radial surface brightness profiles were extracted and fitted using the best-fit model. In addition, spectra were extracted from each sector and fitted with a TBABS * APEC model, resulting in radial temperature profiles (see Fig. 8).
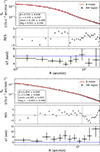 |
Fig. 8. Radial temperature and surface brightness profiles in the 1.0–8.0 keV energy band based on the regional divisions shown in Fig. 6 (NW and SW). The red curve represents the best-fit model, while the vertical dashed gray lines indicate the locations at which the surface brightness residuals change, corresponding to the dashed black lines in Fig. 6. The horizontal blue line serves as a reference, corresponding to a temperature of 6 keV. |
The results show that, in the northwestern direction, the radial surface brightness shows a deficiency within a radius of 3′ compared to the model, which corresponds to the outer boundary of the U-shaped structure in that direction. Between 3′ and 6′, the surface brightness shows an excess corresponding to the fan-shaped structure in the residual map. Around 6′, the radial temperature profile shows no pronounced discontinuity and exhibits only a slight increase. However, the line-of-sight projection of the cold sloshing tail could reduce the apparent temperature contrast. Alternatively, the presence of a weak cold front at this radius cannot be excluded.
In the southwestern direction, the surface brightness residual exhibits a deficiency within a radius of 3′, while at approximately 11.5′, the brightness shifts from an excess to a deficiency. This location may correspond to the outer boundary of the enhanced-brightness region in the southwest. However, within this region, the overall temperature remains consistently above 6 keV, but the radial temperature profile shows no pronounced discontinuity; consequently, there is no evidence of shock heating.
By combining the 1D (see Fig. 5) and 2D (see Fig. 7) temperature analyses, it is clear that the northern region is significantly cooler than the south. In Fig. 5, the temperature drop around 5′ is primarily associated with the northern sector, which corresponds in Fig. 7 to a fan-shaped region of low temperature and low entropy. In contrast, the XMM-Newton results do not show a pronounced temperature decrease, likely due to the limited FoV and reduced sensitivity. Nevertheless, the XMM-Newton data also reveal a temperature asymmetry between the north and south. We therefore suggest that this feature likely results from dynamical activity along the north–south axis.
Based on the above analysis, we propose that the structure of A3571 originates from gas sloshing triggered by the off-axis passage of a low-mass subcluster moving from south to north. The sloshing displaces low-entropy gas from the cool core, producing a fan-shaped brightness excess to the north. At the same time, the central region, originally filled with dense, cool gas, is replenished with diffuse hot gas, resulting in the observed U-shaped surface brightness deficit. This is consistent with the results of numerical simulations (Ascasibar & Markevitch 2006). These simulations show that even a low-mass subcluster, during an off-axis passage, can gravitationally disturb the main cluster, shifting its central mass peak and, through a reversal of ram pressure, eject cool gas from the bottom of the potential well. This process initiates persistent sloshing that can naturally generate fan-shaped distributions of cool gas and U-shaped surface brightness deficits similar to those observed in A3571.
5. Conclusion
We performed a systematic X-ray analysis of the galaxy cluster A3571, combining optical observations with X-ray data obtained from the EP-FXT telescope, which features a large FoV and low particle background. We measured the cluster’s outer properties beyond R500 in the imaging domain. The main results of this work are summarized as follows:
-
Our data provide a high-quality image of A3571 within radius R500. It exhibits a relatively regular morphology. Both the surface brightness and temperature profiles exhibit typical cool-core characteristics.
-
Two prominent regions of surface brightness excesses are detected within 20′ of the cluster center, located to the north and southwest. The southwestern excess is associated with high-temperature features, whereas the northern excess corresponds to a cooler structure. The northern low-temperature feature is most likely produced by gas sloshing occurring primarily along the line of sight and triggered by the off-axis passage of a low-mass subcluster.
-
The temperature distribution of A3571 shows a pronounced north–south asymmetry, consistent with previous XMM-Newton observations. A similar north–south elongation is also evident in the optical galaxy density distribution, suggesting that the cluster’s merger activity occurred along this axis.
-
We detect no thermal emission from the direction of A3572, nor do we find any excess in the density of optical galaxies. This implies that, if A3572 exists, it may host an extremely weak ICM or represent a poor system that is not detectable with the currently available X-ray and optical data. In contrast, the galaxy density distribution and X-ray morphology indicate that A3571 is still recovering from a minor merger and is currently in the post-merger phase.
The results of this study are limited by the calibration uncertainties of EP-FXT, which primarily affect measurements of the outer temperature and thermodynamic properties. Data from the formal observational phase (beginning in June 2024) are not affected by this issue. We expect that more comprehensive studies of the hot gas in galaxy clusters will be possible with these improved data.
Acknowledgments
This work has been supported by the National Natural Science Foundation of China No. 12573003, the National Key Research and Development Program of China (No. 2023YFC2206704), National Key R&D Program of China No. 2025YFF0511104, the International Partnership Program of Chinese Academy of Sciences, Grant No. 013GJHZ2024015FN and the China Manned Space Program with grant No. CMS-CSST-2025-A04. A.L. acknowledges the supports from the National Natural Science Foundation of China (Grant No. 12588202). This work is based on data obtained with Einstein Probe, a space mission supported by Strategic Priority Program on Space Science of Chinese Academy of Sciences, in collaboration with ESA, MPE and CNES (Grant No. XDA15310000). EP is a space mission supported by Strategic Priority Program on Space Science of Chinese Academy of Sciences, in collaboration with ESA, MPE and CNES (Grant No.XDA15310303, No.XDA15310103, No.XDA15052100).
References
- Ascasibar, Y., & Markevitch, M. 2006, ApJ, 650, 102 [Google Scholar]
- Asplund, M., Grevesse, N., Sauval, A. J., & Scott, P. 2009, ARA&A, 47, 481 [NASA ADS] [CrossRef] [Google Scholar]
- Dey, A., Schlegel, D. J., Lang, D., & Blum, R. 2019, AJ, 157, 168 [NASA ADS] [CrossRef] [Google Scholar]
- Edge, A. C., Stewart, G. C., Fabian, A. C., & Arnaud, K. A. 1990, MNRAS, 245, 559 [NASA ADS] [Google Scholar]
- Fabian, A. C., Sanders, J. S., Taylor, G. B., et al. 2006a, MNRAS, 366, 417 [NASA ADS] [CrossRef] [Google Scholar]
- Fabian, A. C., Sanders, J. S., Taylor, G. B., et al. 2006b, MNRAS, 366, 417 [NASA ADS] [CrossRef] [Google Scholar]
- Ghizzardi, S., De Grandi, S., & Molendi, S. 2014, A&A, 570, A117 [NASA ADS] [CrossRef] [EDP Sciences] [Google Scholar]
- Hudaverdi, M., Yamashita, K., & Furuzawa, A. 2005, Adv. Space Res., 36, 643 [Google Scholar]
- Kadam, S. K., Salunkhe, S., Vagshette, N. D., et al. 2024a, MNRAS, 531, 4060 [Google Scholar]
- Kadam, S. K., Sonkamble, S. S., Vagshette, N. D., & Patil, M. K. 2024b, New Astron., 111, 102253 [Google Scholar]
- Kemp, S., & Meaburn, J. 1991, MNRAS, 251, 10P [Google Scholar]
- Koda, J., Milosavljević, M., Shapiro, P. R., Nagai, D., & Nakar, E. 2008, ASP Conf. Ser., 393, 223 [Google Scholar]
- Kravtsov, A. V., & Borgani, S. 2012, ARA&A, 50, 353 [Google Scholar]
- Laganá, F. T., Durret, F., & Lopes, P. A. A., 2019, Tracing Cosmic Evolution with Clusters of Galaxies, 117 [Google Scholar]
- Lauer, T. R., Postman, M., Strauss, M. A., Graves, G. J., & Chisari, N. E. 2014, ApJ, 797, 82 [Google Scholar]
- Liu, A., Yu, H., Diaferio, A., et al. 2018, ApJ, 863, 102 [NASA ADS] [CrossRef] [Google Scholar]
- Markevitch, M., & Vikhlinin, A. 2007, Phys. Rep., 443, 1 [Google Scholar]
- Markevitch, M., Forman, W. R., Sarazin, C. L., & Vikhlinin, A. 1998, ApJ, 503, 77 [NASA ADS] [CrossRef] [Google Scholar]
- Markevitch, M., Ponman, T. J., Nulsen, P. E. J., et al. 2000, ApJ, 541, 542 [Google Scholar]
- Markevitch, M., Gonzalez, A. H., David, L., et al. 2002, ApJ, 567, L27 [Google Scholar]
- Nevalainen, J., Markevitch, M., & Forman, W. 2000, ApJ, 536, 73 [Google Scholar]
- Nevalainen, J., Kaastra, J., Parmar, A. N., et al. 2001, A&A, 369, 459 [NASA ADS] [CrossRef] [EDP Sciences] [Google Scholar]
- Owers, M. S., Couch, W. J., & Nulsen, P. E. J. 2009, ApJ, 693, 901 [Google Scholar]
- Planck Collaboration VI. 2020, A&A, 641, A6 [NASA ADS] [CrossRef] [EDP Sciences] [Google Scholar]
- Quintana, H., & De Souza, R. 1993, A&AS, 101, 475 [Google Scholar]
- Rahaman, M., Raja, R., & Datta, A. 2022, MNRAS, 509, 5821 [Google Scholar]
- Raychaudhury, S., Fabian, A. C., Edge, A. C., Jones, C., & Forman, W. 1991, MNRAS, 248, 101 [NASA ADS] [Google Scholar]
- Roediger, E., Brüggen, M., Simionescu, A., et al. 2011, MNRAS, 413, 2057 [Google Scholar]
- Rossetti, M., & Molendi, S. 2010, A&A, 510, A83 [NASA ADS] [CrossRef] [EDP Sciences] [Google Scholar]
- Sasaki, T., Matsushita, K., Sato, K., & Okabe, N. 2016, PASJ, 68, 85 [Google Scholar]
- Sonkamble, S. S., Kadam, S. K., Paul, S., et al. 2024, J. Astrophys. Astron., 45, 23 [Google Scholar]
- Struble, M. F., & Rood, H. J. 1999, ApJS, 125, 35 [Google Scholar]
- Venturi, T., Bardelli, S., Zagaria, M., Prandoni, I., & Morganti, R. 2002, A&A, 385, 39 [NASA ADS] [CrossRef] [EDP Sciences] [Google Scholar]
- Vikhlinin, A., Markevitch, M., & Murray, S. S. 2001, ApJ, 551, 160 [CrossRef] [Google Scholar]
- Vikhlinin, A. A., Kravtsov, A. V., Markevich, M. L., Sunyaev, R. A., & Churazov, E. M. 2014, Phys. Uspekhi, 57, 317 [Google Scholar]
- Walker, S. A., Hlavacek-Larrondo, J., Gendron-Marsolais, M., et al. 2017, MNRAS, 468, 2506 [NASA ADS] [CrossRef] [Google Scholar]
- Wen, Z. L., & Han, J. L. 2013, MNRAS, 436, 275 [Google Scholar]
- Willingale, R., Starling, R., Beardmore, A. P., Tanvir, N. R., & O’Brien, P. T. 2013, MNRAS, 431, 394 [NASA ADS] [CrossRef] [Google Scholar]
- Yuan, W., Zhang, C., Chen, Y., & Ling, Z. 2022, in Handbook of X-ray and Gamma-ray Astrophysics, eds. C. Bambi, & A. Sangangelo, 86 [Google Scholar]
- Yuan, W., Dai, L., Feng, H., et al. 2025, Sci. China Phys. Mech. Astron., 68, 239501 [Google Scholar]
- Zhang, J., Qi, L., Yang, Y., et al. 2022, Astropart. Phys., 137, 102668 [Google Scholar]
- Zhang, J., Chen, Y., Jia, S., et al. 2025, Res. Astron. Astrophys., 25, 115019 [Google Scholar]
- Zhao, H.-S., Li, C.-K., Wang, J., et al. 2025, Radiation Detection Technology and Methods, 9, 215 [Google Scholar]
- Zheng, X., Jia, S., Li, C., et al. 2025, A&A, 700, A248 [NASA ADS] [CrossRef] [EDP Sciences] [Google Scholar]
- ZuHone, J. A., Markevitch, M., & Johnson, R. E. 2010, ApJ, 717, 908 [Google Scholar]
The European X-ray Observatory Satellite.
The Advanced Satellite for Cosmology and Astrophysics.
The ROentgen SATellite.
Appendix A: Comparison of temperatures
To evaluate the consistency between FXT-A and FXT-B, we performed spectral fits in the 1.0–8.0 keV band within the Voronoi-defined regions (see Sect.3.2.2), using the TBABS*APEC model with the same parameter settings as in Sect.3.1.3. The temperature measurements were then compared (see Fig. A.1). The results show that the temperatures obtained with FXT-A and FXT-B are consistent within the uncertainties. Although FXT-A yields slightly higher values than FXT-B, this discrepancy is likely due to FXT-B’s larger effective area at low energies and calibration differences between the two instruments.
In addition, the observation of A3571 was carried out during the performance verification phase in March, whereas the formal calibration campaign was not systematically initiated until April. Consequently, in the absence of finalized calibration products, these data are unavoidably affected by calibration-related systematic uncertainties.
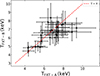 |
Fig. A.1. Comparison of FXT-A and FXT-B temperatures in the 1.0-8.0 keV energy band. The dashed red line represents 1:1. |
All Tables
All Figures
|
Fig. 1. Particle-background-subtracted, vignetting-corrected, and smoothed EP-FXT image of A3571 in the 0.3–7.0 keV energy band. The green circle is R500 (1.29 Mpc). |
| In the text | |
|
Fig. 2. Galaxy luminosity density map, generated from optical photometric data (galaxies with r-band magnitudes Rc < 22 and redshifts in the range 0.019–0.079), revealing a north–south extension. The red cross indicates the BCG, the yellow triangle marks the X-ray peak (RA = 206.86°, Dec = − 32.86°), the purple star shows the position of A3572, the green rectangles denote the FoV of EP-FXT, and the black contours show the X-ray isophotes. |
| In the text | |
|
Fig. 3. Normalized surface brightness profiles measured with EP-FXT and XMM-Newton. The black points represent the EP-FXT data, and the solid red line shows the best-fit double-β model, including background components. The blue points correspond to the EP-FXT surface brightness after subtraction of both the particle and sky backgrounds, fitted with a double-β model without backgrounds. The best-fit curve is shown as the solid black line, while the dashed orange and green lines indicate the two individual components of this model. The cyan points are the XMM-Newton data. The horizontal solid blue and green lines denote the particle background from fxtbkggen and sky background levels for EP-FXT, respectively, while the horizontal dashed blue and green lines indicate the particle and sky background levels for XMM-Newton. |
| In the text | |
|
Fig. 4. Spectrum of A3571 extracted within a 20′ radius centered on the X-ray peak. The blue and red points represent the observational data from FXT-A and FXT-B, respectively. The green and brown points correspond to their particle backgrounds, and the orange and purple points represent the sky backgrounds after subtraction of the particle background. |
| In the text | |
|
Fig. 5. Radial temperature profile of A3571. The black circles show the temperature distribution measured using EP-FXT in this study. The blue dots and green squares correspond to the XMM-Newton data and the ASCA data reported by Hudaverdi et al. (2005). The purple and yellow triangles indicate the temperature profile measured by EP-FXT in the southern and northern directions, respectively. The vertical dashed gray line indicates the location of R2500. |
| In the text | |
|
Fig. 6. Residual map of A3571. It was obtained by subtracting an elliptical β model with an added constant component from Fig. 1. The two sectors are regions of radial analysis in the subsequent sections. |
| In the text | |
|
Fig. 7. Voronoi Tessellation method applied to partition A3571 and spectral fitting performed for each subregion in the 1.0–8.0 keV energy band. Top left: Temperature map. Top right: Temperature error map. Bottom left: Pseudo-pressure map. Bottom right: Pseudo-entropy map. Contours in different colors represent the different intensity levels in Fig. 6. |
| In the text | |
|
Fig. 8. Radial temperature and surface brightness profiles in the 1.0–8.0 keV energy band based on the regional divisions shown in Fig. 6 (NW and SW). The red curve represents the best-fit model, while the vertical dashed gray lines indicate the locations at which the surface brightness residuals change, corresponding to the dashed black lines in Fig. 6. The horizontal blue line serves as a reference, corresponding to a temperature of 6 keV. |
| In the text | |
|
Fig. A.1. Comparison of FXT-A and FXT-B temperatures in the 1.0-8.0 keV energy band. The dashed red line represents 1:1. |
| In the text | |
Current usage metrics show cumulative count of Article Views (full-text article views including HTML views, PDF and ePub downloads, according to the available data) and Abstracts Views on Vision4Press platform.
Data correspond to usage on the plateform after 2015. The current usage metrics is available 48-96 hours after online publication and is updated daily on week days.
Initial download of the metrics may take a while.