Fig. 3.
Download original image
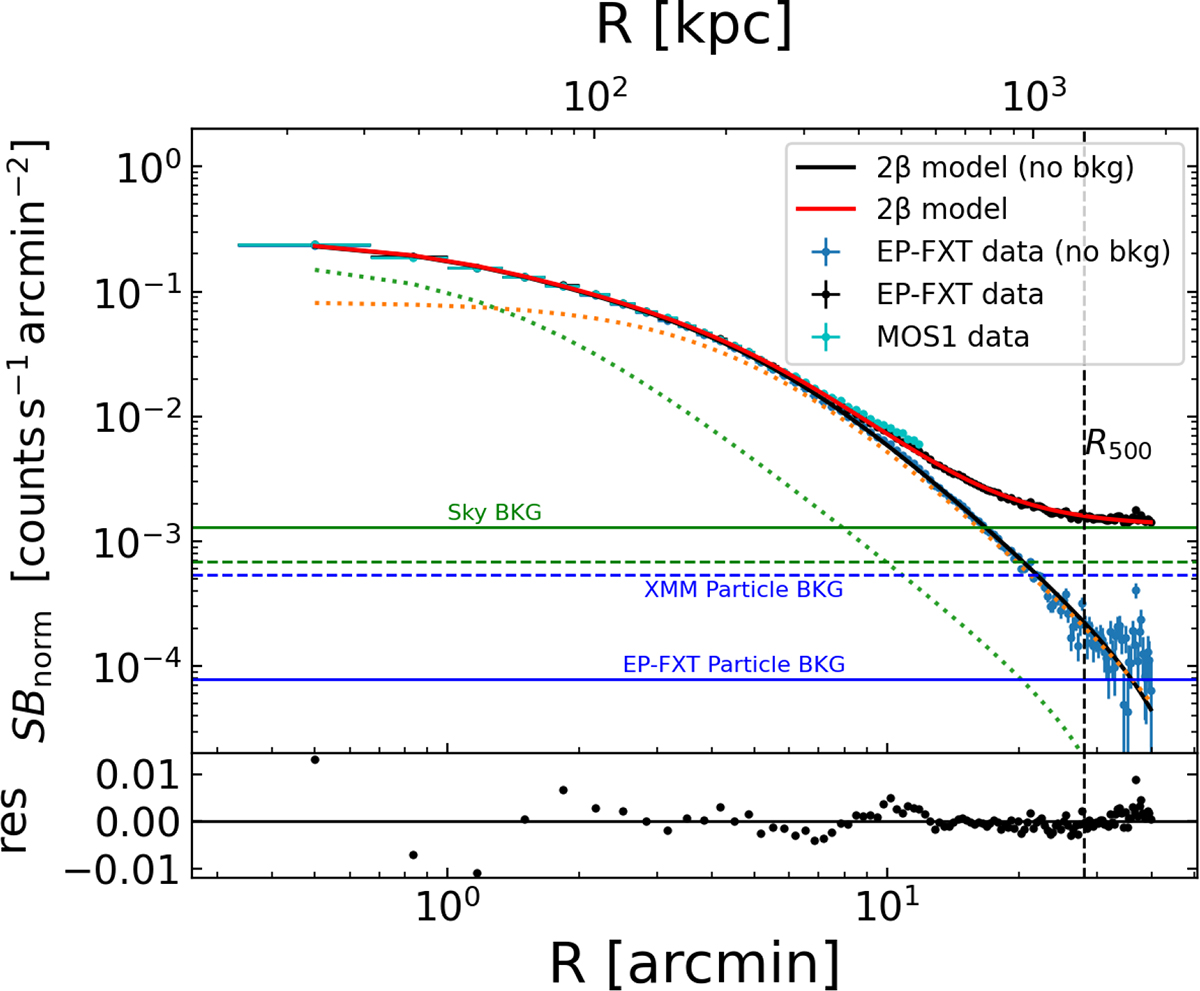
Normalized surface brightness profiles measured with EP-FXT and XMM-Newton. The black points represent the EP-FXT data, and the solid red line shows the best-fit double-β model, including background components. The blue points correspond to the EP-FXT surface brightness after subtraction of both the particle and sky backgrounds, fitted with a double-β model without backgrounds. The best-fit curve is shown as the solid black line, while the dashed orange and green lines indicate the two individual components of this model. The cyan points are the XMM-Newton data. The horizontal solid blue and green lines denote the particle background from fxtbkggen and sky background levels for EP-FXT, respectively, while the horizontal dashed blue and green lines indicate the particle and sky background levels for XMM-Newton.
Current usage metrics show cumulative count of Article Views (full-text article views including HTML views, PDF and ePub downloads, according to the available data) and Abstracts Views on Vision4Press platform.
Data correspond to usage on the plateform after 2015. The current usage metrics is available 48-96 hours after online publication and is updated daily on week days.
Initial download of the metrics may take a while.