Fig. 5.
Download original image
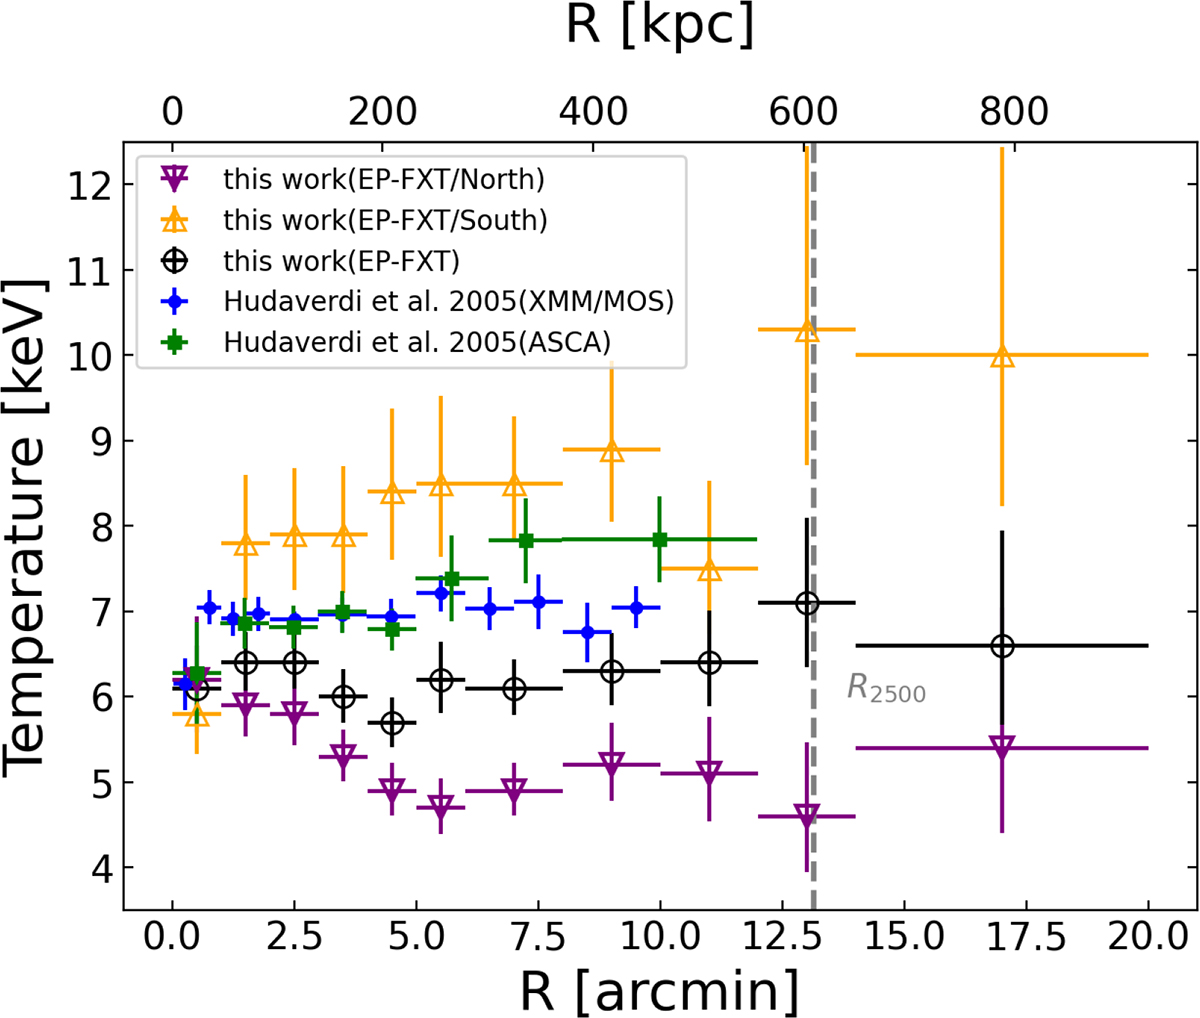
Radial temperature profile of A3571. The black circles show the temperature distribution measured using EP-FXT in this study. The blue dots and green squares correspond to the XMM-Newton data and the ASCA data reported by Hudaverdi et al. (2005). The purple and yellow triangles indicate the temperature profile measured by EP-FXT in the southern and northern directions, respectively. The vertical dashed gray line indicates the location of R2500.
Current usage metrics show cumulative count of Article Views (full-text article views including HTML views, PDF and ePub downloads, according to the available data) and Abstracts Views on Vision4Press platform.
Data correspond to usage on the plateform after 2015. The current usage metrics is available 48-96 hours after online publication and is updated daily on week days.
Initial download of the metrics may take a while.