Fig. 7.
Download original image
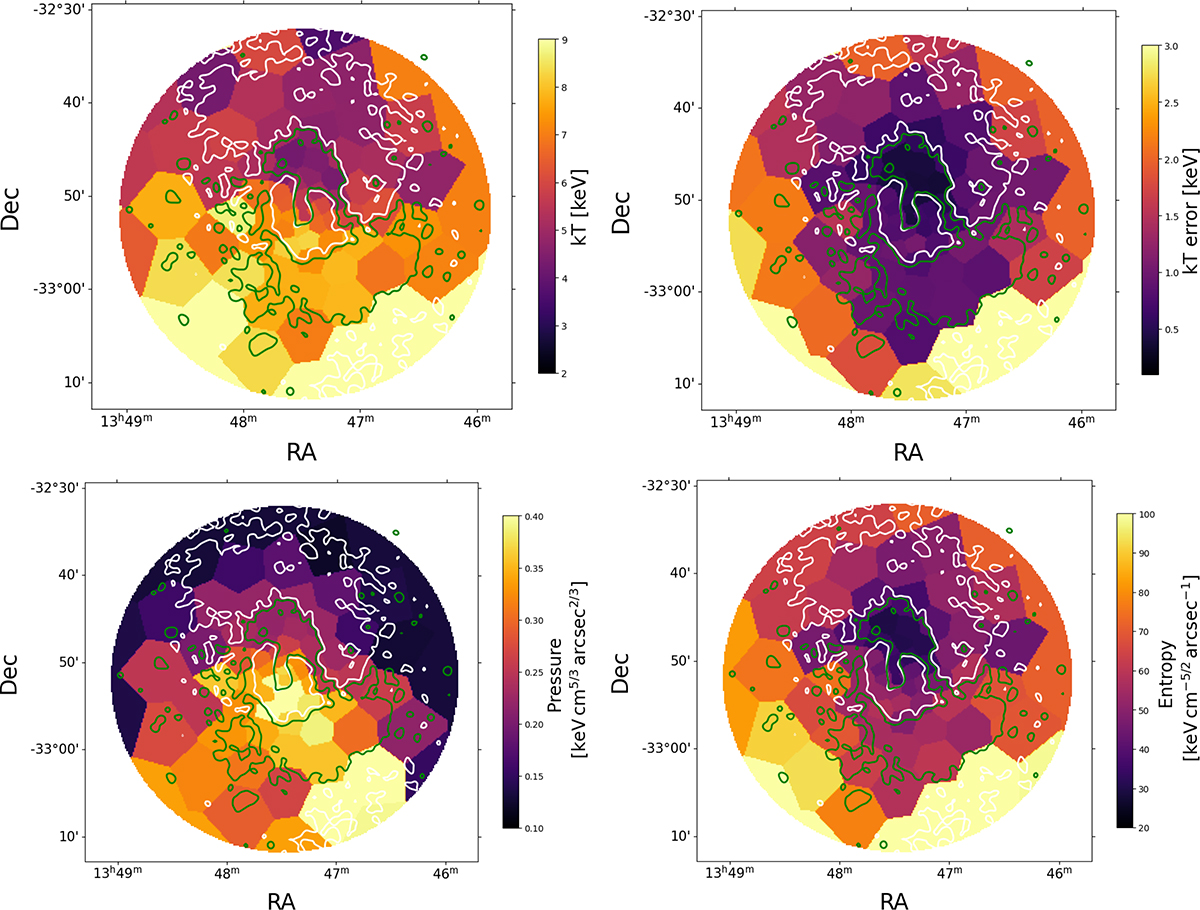
Voronoi Tessellation method applied to partition A3571 and spectral fitting performed for each subregion in the 1.0–8.0 keV energy band. Top left: Temperature map. Top right: Temperature error map. Bottom left: Pseudo-pressure map. Bottom right: Pseudo-entropy map. Contours in different colors represent the different intensity levels in Fig. 6.
Current usage metrics show cumulative count of Article Views (full-text article views including HTML views, PDF and ePub downloads, according to the available data) and Abstracts Views on Vision4Press platform.
Data correspond to usage on the plateform after 2015. The current usage metrics is available 48-96 hours after online publication and is updated daily on week days.
Initial download of the metrics may take a while.