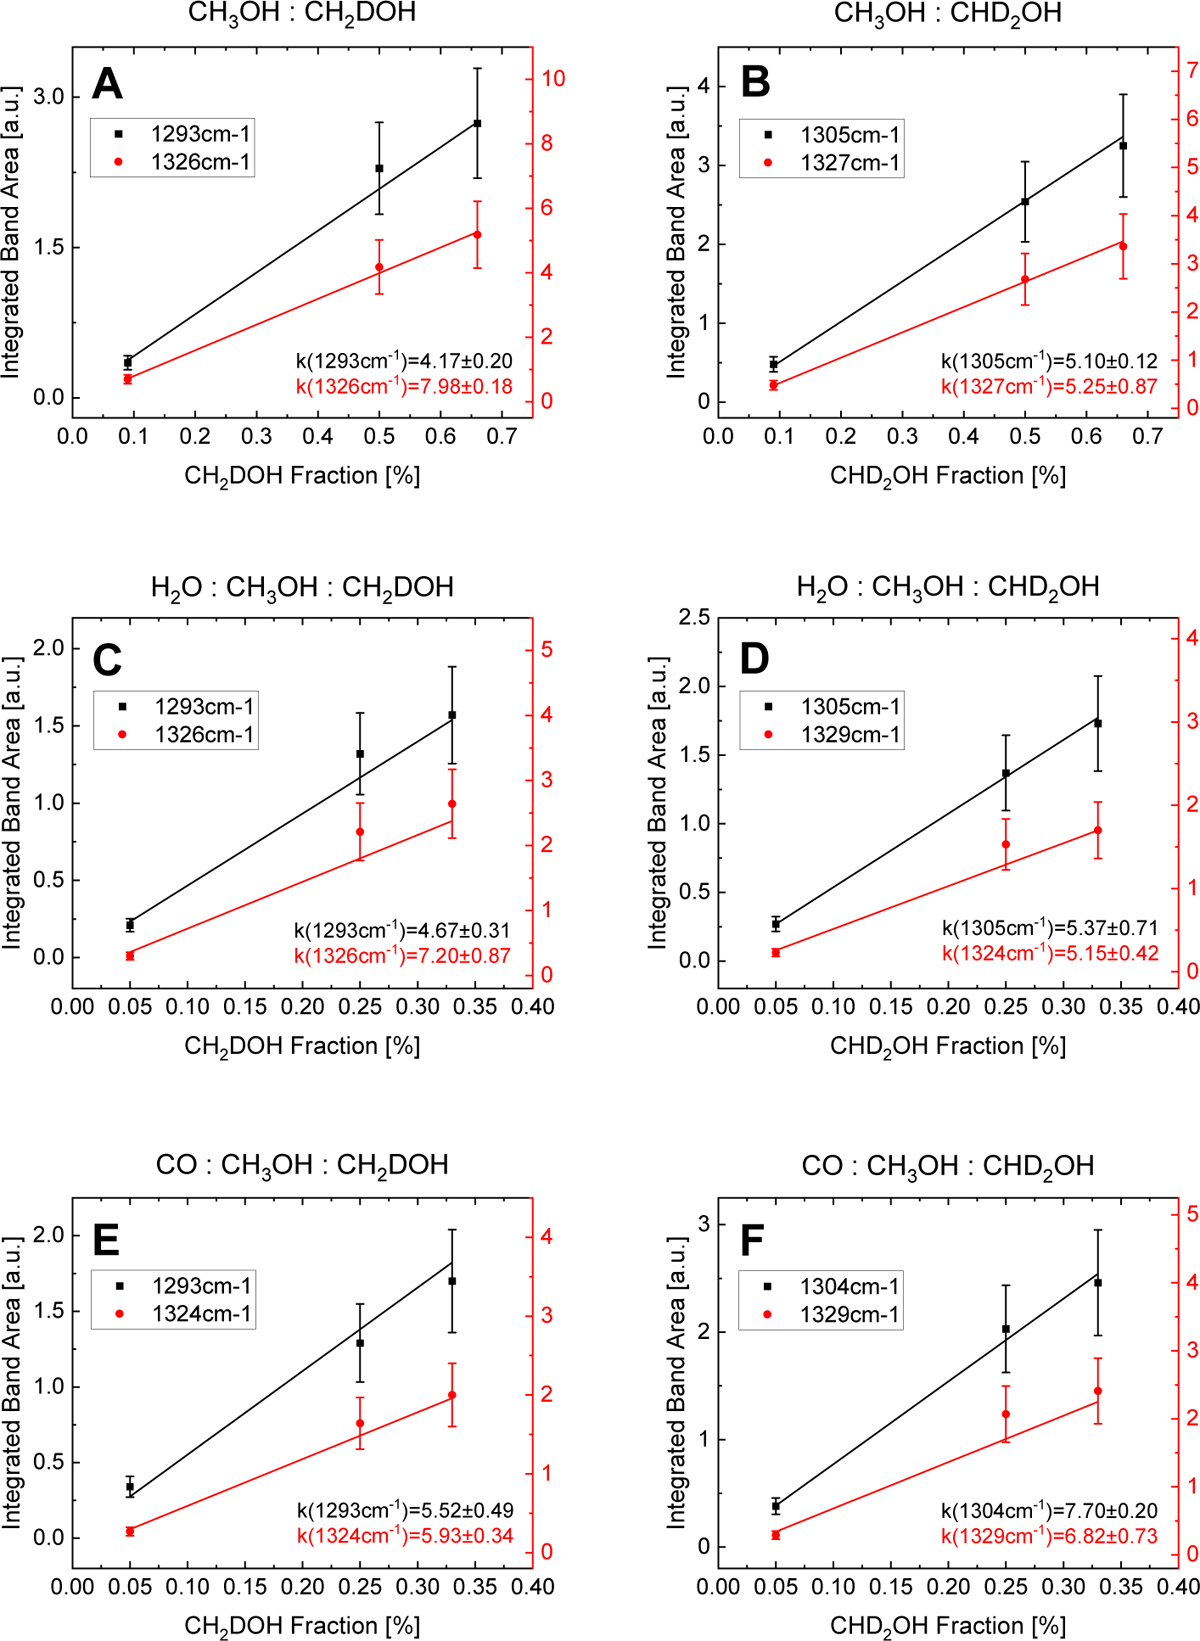
Fig. C.2
Download original image
Integrated areas of the doublets marked in regions A–F of Fig. C.1. Panels A–F correspond to the same spectra shown in Fig. C.1. For each spectral window, the two peak components were integrated separately as a function of increasing deuterated methanol concentration, and the resulting band areas were plotted against the total fraction of CH2DOH and CHD2OH in the ice, showing an approximately linear dependence across all mixture types.
Current usage metrics show cumulative count of Article Views (full-text article views including HTML views, PDF and ePub downloads, according to the available data) and Abstracts Views on Vision4Press platform.
Data correspond to usage on the plateform after 2015. The current usage metrics is available 48-96 hours after online publication and is updated daily on week days.
Initial download of the metrics may take a while.