| Issue |
A&A
Volume 707, March 2026
|
|
|---|---|---|
| Article Number | A214 | |
| Number of page(s) | 20 | |
| Section | Interstellar and circumstellar matter | |
| DOI | https://doi.org/10.1051/0004-6361/202557702 | |
| Published online | 17 March 2026 | |
Broadband infrared spectroscopy of methanol isotopologues in pure, H2O-rich, and CO-rich ice analogues
1
Max-Planck-Institut für extraterrestrische Physik,
Gießenbachstraße 1,
85748
Garching,
Germany
2
Supramolecular, Interfacial and Synthetic Chemistry, School of Natural Sciences, University of Kent,
Park Wood Rd,
Canterbury
CT2 7NH,
UK
3
HUN-REN Institute for Nuclear Research (Atomki),
Debrecen
4026,
Hungary
4
INAF – Osservatorio Astrofisico di Catania,
via Santa Sofia 78,
95123
Catania,
Italy
★ Corresponding author: This email address is being protected from spambots. You need JavaScript enabled to view it.
Received:
15
October
2025
Accepted:
22
January
2026
Abstract
Deuterium fractionation is highly efficient during the early stages of star formation, particularly in starless and prestellar cores where temperatures are low (<10 K) and molecular freeze-out onto dust grains is significant. Methanol forms early in these environments following CO freeze-out via successive hydrogenation reactions on grain surfaces, while the production of deuterated methanol requires elevated gas-phase D/H ratios generated through dissociative recombination of deuterated H3+. Consequently, large abundances of deuterated methanol are observed towards young stellar objects where prestellar ices have recently sublimated. Here, we present laboratory broadband infrared spectra of methanol and its isotopologues in astrophysical ice analogues, complemented by anharmonic vibrational calculations used to guide band assignments. Experiments were performed at the CASICE laboratory using a Bruker Vertex 70v spectrometer coupled to a closed-cycle helium cryostat, with isotopologue ices deposited at 10 K under high-vacuum conditions. Infrared transmission spectra were recorded over 6000 to 30 cm−1 (1.67 to 333 µm) and compared with spectra of pure isotopologue ices. Distinctive mid-infrared band patterns are identified for each deuterated species. In particular, CH2DOH exhibits a characteristic doublet at 1293 cm−1 and 1326 cm−1 (7.73 µm and 7.54 µm), while CHD2OH shows a similar doublet at 1301 cm−1 and 1329 cm−1 (7.69 µm and 7.52 µm), both remaining largely invariant across all studied ice mixtures. These robust spectral signatures provide reliable tracers for identifying deuterated methanol in JWST observations and for constraining astrochemical gas–grain models of deuterium enrichment prior to star and planet formation.
Key words: astrochemistry / molecular data / methods: laboratory: molecular / techniques: spectroscopic / ISM: molecules
© The Authors 2026
 Open Access article, published by EDP Sciences, under the terms of the Creative Commons Attribution License (https://creativecommons.org/licenses/by/4.0), which permits unrestricted use, distribution, and reproduction in any medium, provided the original work is properly cited.
This article is published in open access under the Subscribe to Open model.
Open Access funding provided by Max Planck Society.
1 Introduction
Methanol (CH3OH) is a key organic molecule in the interstellar medium (ISM) and is commonly detected in dense clouds and star-forming regions (Bizzocchi et al. 2014; Jørgensen et al. 2020; Punanova et al. 2022). CH3OH is formed primarily on the surface of dust grains via successive hydrogenation of CO molecules (Watanabe & Kouchi 2002; Fuchs et al. 2009). In starless and prestellar cores, catastrophic CO freeze-out produces CO-rich ices, enhancing surface production and enabling reactive desorption of a fraction of the freshly formed CH3OH into the gas phase (Minissale et al. 2015; Vasyunin et al. 2017). In these regions, deuterium fractionation becomes highly effective, as low temperatures and high levels of molecular freeze-out favour the production of deuterated forms of  (Caselli et al. 2003; Walmsley et al. 2004). Dissociative recombination of H2D+, D2H+, and
  increases the atomic D/H ratio in the gas phase, allowing deuterium atoms to compete with hydrogen atoms in reactions with surface CO, producing deuterated methanol (Caselli 2002; Ceccarelli et al. 2014). Methanol and its singly and doubly deuterated isotopologues have been detected in prestellar cores (Bizzocchi et al. 2014; Chacón-Tanarro et al. 2019; Lin et al. 2023) and towards Class 0 protostars (Quitián-Lara et al. 2024), with triply deuterated methanol also reported in some sources (Parise et al. 2004). A significant abundance of methanol ice has been reported towards the prototypical prestellar core L1544 (Goto et al. 2021). Therefore, deuterated methanol ice is also expected to be abundant in similar environments.
Upcoming and ongoing observations from the James Webb Space Telescope (JWST) are now enabling more detailed studies of interstellar ices, including complex organic molecules and their isotopologues (Sturm et al. 2023; McClure et al. 2023). To interpret these infrared spectra, robust laboratory reference data are required. Laboratory astrophysics experiments therefore provide key band assignments, band strengths, and temperature-dependent spectral profiles under controlled, ISM-like conditions (Cuppen et al. 2024; Giuliano et al. 2014; Linnartz et al. 2015; Giuliano et al. 2016; Ligterink et al. 2018; Müller et al. 2022; Rocha et al. 2022; Dickers et al. 2025). These benchmarks also enable identification of isotopologue-specific signatures and help to constrain the chemical composition of interstellar ices in dark and cold molecular clouds (Brunken et al. 2024; Dartois et al. 2024; McClure et al. 2023; Rocha et al. 2024, 2025; Spezzano et al. 2025; Tyagi et al. 2025; van Gelder et al. 2024).
For example, laboratory investigations of solid CH2DOH, both in pure form and in mixtures, have demonstrated the importance of measuring refractive indices, densities, band intensities, and temperature-dependent profile changes under high-vacuum conditions, supported by precise thickness determinations using laser interferometry (Palumbo et al. 2015; Urso et al. 2018; Scirè et al. 2019). These studies motivate the present work, which adopts a broader scope by providing a systematic, broadband infrared characterisation of methanol and its five main isotopologues, in pure ice and within H2O-rich and CO-rich matrices.
In this work, we present a laboratory investigation of methanol and its isotopologues (CH3OD, CH2DOH, CHD2OH, CD3OH, CD3OD) under astro-physically relevant ice conditions, supported by anharmonic vibrational calculations to assist in the assignment of fundamental, overtone, and combination bands. Throughout this paper, “methanol” refers to the fully hydrogenated isotopologue CH3OH, whereas “deuterated methanol” denotes the isotopologues listed above. In particular, we examine pure samples and binary mixtures with H2O or CO deposited at 10 K onto a silicon substrate, and follow their evolution upon heating to 120 K. By recording infrared spectra in transmission mode over a broad spectral range of 6000 to 30 cm−1 (1.67 to 333 μm), we identify distinct band profiles, assess the influence of mixing ratios and temperature on spectral signatures, and provide benchmarks for interpreting future astronomical observations. Our results, combined with JWST data, will help constrain astrochemical models of methanol deuteration in star-forming regions and support the use of deuterated methanol as a tracer of early ice chemistry.
2 Experimental methods
The experiments were conducted at the Centre for Astrochemical Studies (CAS) at the Max Planck Institute for Extraterrestrial Physics, Garching, Germany, using a custom-designed apparatus. The setup integrates a closed-cycle helium cryocooler (Advanced Research Systems, ARS) with a Bruker Vertex 70v spectrometer. The experimental vacuum chamber, attached to the cryocooler and mounted directly within the spectrometer’s sample compartment, can be positioned precisely on a motorised stage.
2.1 Experimental setup
Infrared (IR) spectra were obtained in transmission mode over 6000 to 30 cm−1 (1.67 to 333 μm) at 10 K using Fourier transform infrared spectroscopy (FTIR), probing ice films deposited on both sides of the silicon substrate. Each spectrum was recorded with a Bruker Vertex 70v spectrometer equipped with a deuterated triglycine sulphate (DTGS) detector, using an 8 mm aperture and a spectral resolution of 1 cm−1. A total of 64 scans were averaged, as increasing to 128 did not significantly improve the signal-to-noise ratio.
A schematic diagram of the cryostat setup is shown in Fig. 1. The cryostat is equipped with two optical ports and a gas injection port. The gas inlet, positioned approximately 7 cm from the substrate, was not directed towards the substrate in order to ensure uniform background ice deposition on both sides. Temperature control and stabilisation were achieved using a silicon diode sensor connected to a Lake Shore Model 335 controller. High-resistivity float-zone silicon (HRFZ-Si) windows, purchased from Tydex, were used as optical interfaces. The substrate onto which the ices were deposited was made of the same material.
The vacuum system comprised a turbomolecular pump with a nitrogen pumping speed of 85 L s−1, backed by a rotary pump with a capacity of 5 m3 h−1. This configuration yielded a base pressure of approximately 1 × 10⁻⁷ mbar upon cooling to 10 K. Under normal operating conditions, the minimum measurable temperature at the sample holder reached 5 K. Further details of the cryogenic setup are provided in Giuliano et al. (2019).
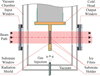 |
Fig. 1 Schematic representation of the cryostat’s vacuum chamber, coupled to the Bruker Vertex 70v spectrometer at CAS. Adapted from Giuliano et al. (2019). |
2.2 Ice preparation
The samples used for ice preparation included H2O (distilled), CO (Linde gas, >99% purity), CH3OD (methanol-OD, Sigma Aldrich, >99% purity), CH2DOH (methanol-d1, Cambridge Isotope Laboratories, >98% purity), CHD2OH (methanol-d2, Sigma Aldrich, >98% purity), CD3OH (methanol-d3, Thermo Fisher Scientific, >99.5% purity, NMR grade), and CD3OD (methanol-d4, Sigma Aldrich, >99.8% purity). All liquid samples were purified using three freeze–pump–thaw cycles to remove volatile contaminants.
The purified gases were then mixed in a stainless-steel cylinder (Swagelok) at specified ratios, with partial pressures calculated using the ideal gas law. The gas mixture was introduced into the vacuum chamber through a 6 mm stainless-steel pipe, controlled by a metering valve. Upon expansion into the vacuum chamber, the gas condensed onto the silicon substrate, forming an ice layer. Following initial data acquisition at 10 K, the ice samples were subsequently heated to 120 K at a rate of 1 to 2 K min−1. Once 120 K was reached, the samples were held at this temperature for one hour to allow the annealing process to stabilise.
For pure methanol ices and binary mixtures containing CO, each sample was deposited in 30 s increments, resulting in a total deposition time of 3 min. Spectra were acquired after each incremental deposition step. After 2 min of deposition, the gas mixing chamber was evacuated and refilled to restore its initial gas mixture and pressure. Under these conditions, the maximum pressure in the cryostat chamber during deposition reached approximately 1 × 10⁻³ mbar, and the sample holder temperature remained within 2 K of its initial value.
For mixtures containing H2O, the total deposition time was extended to 10 min due to the vapour pressure of H2O being approximately five times lower than that of methanol. This adjustment resulted in a lower total pressure in the mixing chamber to maintain the desired mixture ratios. The deposition process was conducted in 2 min steps. To ensure stable and uniform deposition conditions, the gas mixing chamber was evacuated and refilled with the initial gas composition after 6 min. Spectra were collected following each deposition step. Under these conditions, the maximum pressure in the cryostat chamber reached approximately 1 × 10⁻³ mbar, while the sample holder temperature remained stable within 2 K of its initial value.
A summary of the ice compositions and temperatures used for each experiment is presented in Table 1.
List of astrophysical ice analogues used in the experiments.
2.3 Film thickness
For independent ice film thickness measurements, the cryostat unit was removed from the spectrometer’s sample compartment, and the original silicon windows were replaced with quartz windows. A He–Ne laser (633 nm) was directed onto each side of the substrate at incidence angles of θi = 13◦ and θi = 9.5◦ (∆θi = 0.5◦). Reflected beams from each side were measured using a Thorlabs powermeter. Individual thicknesses were determined by counting interference maxima on each side, and the total film thickness was obtained by summing the contributions from both sides. Table 2 summarises the ice thicknesses and the average deposition rates derived for the laboratory ice mixtures. The total ice film thickness was determined using
 (1)
(1)
This expression is derived from thin-film interference at oblique incidence. Here, ∆d represents the ice thickness, N is the number of interference maxima, λ is the wavelength of the laser source, nf is the refractive index of the ice film at 633 nm, and θi is the angle of incidence.
To obtain precise thickness values for our mixtures, we used a FORTRAN routine that generates a theoretical interference curve to find an optimal value for nf. The routine determines the refractive index of the film by varying the nf value until the modelled interference curve reproduces the amplitude of the experimental data1. Further details on the FORTRAN routine can be found in Baratta & Palumbo (1998); Scirè et al. (2019).
2.4 Spectral data fitting
Selected infrared spectra used for band assignment were processed using OriginPro 2024 software. Baseline correction was applied individually to each spectrum using the
Quick Peakroutine, with the Baseline: Min&Max option selected. This method applies a linear baseline defined by the minimum and maximum anchor points identified by the routine and was found to provide stable and reproducible baselines across the analysed spectra.
Peak positions were subsequently determined using the Find Peak: 1st-Derivative Savitzky–Golay algorithm, employing a second-order polynomial and a 20-point smoothing window. Peak maxima were identified from the zero-crossings of the first derivative. The routine simultaneously returns peak height, full width at half maximum (FWHM), and integrated band area following baseline subtraction. Values reported in Tables 3–9 represent averages of three independent fitting runs, with peak positions reproducible within ±1 cm−1 for the spectra used in the band assignment.
Several vibrational regions contain overlapping bands, particularly where multiple bending and deformation modes contribute within a narrow spectral interval. As a result, direct and unambiguous assignment of individual features is not always possible. To maintain clarity, a simplified notation is therefore adopted and introduced in each subsection, enabling systematic comparison of corresponding spectral regions among methanol isotopologues.
Spectral features are grouped according to their vibrational character, with the analysis focusing on the strongest bands of relevance for astrophysical applications. Very weak features, including faint overtones, combination bands, and the lowest-frequency lattice modes, are not discussed in detail, as they fall outside the scope of the present study.
To aid band identification, spectra recorded at 10 K (amorphous ice; see Fig. 2) were compared with spectra acquired after annealing to 120 K (partially crystalline ice; see Fig. B.1). Annealing leads to systematic band sharpening and the separation of features that are blended in the amorphous phase, facilitating comparison of overlapping vibrational modes across isotopologues.
Under identical experimental conditions, peak positions are reproducible to within ±1 cm−1. When additional systematic effects related to baseline treatment, ice thickness, refractive index assumptions, and uncertainties in mixture preparation are taken into account, apparent frequency shifts of 1–3 cm−1 fall within the overall experimental uncertainty. Consequently, small spectral variations discussed in this work are interpreted comparatively rather than as absolute frequency shifts. Integrated band areas and linear correlations are used to quantify relative trends between experiments rather than to derive absolute band strengths.
Film thickness measurements for selected ice samples.
 |
Fig. 2 Transmission spectra of solid methanol and its five isotopologues at 10 K. The region between 650 to 590 cm−1 (15.4 to 16.9 μm), affected by increased noise from the beamsplitter, has been removed. The main CH3OH vibrational modes are indicated at the top. Spectra are vertically offset for clarity. |
2.5 Computational details
Quantum-chemical calculations were performed to support the assignment and interpretation of the experimental infrared spectra, with particular emphasis on overtone and combination bands that are difficult to disentangle experimentally. All calculations were carried out using Gaussian 16, Revision C.01 (Frisch et al. 2016). Molecular geometries were optimised using the double-hybrid density functional B2PLYP (Grimme 2006) in combination with the correlation-consistent aug-cc-pVQZ quadruple-ζ basis set (Dunning 1989; Kendall et al. 1992), employing very tight convergence criteria and an ultrafine integration grid. Harmonic and fully anharmonic vibrational analyses were subsequently performed using second-order vibrational perturbation theory (VPT2), as implemented in Gaussian (Barone 2005).
This computational protocol enables explicit treatment of anharmonic effects and provides access to fundamental vibrations as well as first and second overtones and binary combination bands. The chosen level of theory is equivalent to that employed in the high-accuracy benchmark study of Grabska et al. (2017), and has been shown to yield reliable vibrational frequencies and intensities for methanol and related systems.
For the partially deuterated isotopologues CH2DOH and CHD2OH, only the lowest-energy rotamers of Cs symmetry were considered. This choice reflects the dominant conformers expected under the low-temperature conditions of the experiments and avoids unnecessary duplication of near-degenerate vibrational patterns. Mode assignments were determined by combining graphical inspection of the normal-mode displacement vectors and Bayesian linear regression with automatic relevance determination using the vibrational mode automatic relevance determination (VMARD) approach (Teixeira & Cordeiro 2019). These results were further validated through a systematic comparison with established experimental and theoretical reference data, in particular the methanol vibrational atlas of Moruzzi (2018) and the recent analysis of Dinu et al. (2024).
To improve the quantitative comparison with experiment, calculated frequencies were scaled by reference to literature values compiled by Hänninen & Halonen (2003). The unscaled anharmonic frequencies already show good agreement with experiment, yielding a cumulative relative deviation of 0.0986 when evaluated over the 12 fundamental modes as
 (2)
(2)
Here,  and
and  denote the experimental and calculated frequencies, respectively. Application of a uniform scaling factor of 1.003667 reduces this cumulative deviation slightly to 0.0968. In the following analysis, the scaled anharmonic frequencies are therefore adopted. Given the small magnitude of this correction, both scaled and unscaled results are considered reliable, and the calculations are used primarily to establish the relative ordering, vibrational character, and mode coupling rather than to reproduce absolute band positions.
The anharmonic calculations presented here are employed selectively to support the vibrational assignments discussed in this work. A comprehensive theoretical analysis of methanol and its isotopologues, including a systematic exploration of anharmonic effects and mode couplings, is currently in preparation and will be reported elsewhere.
3 Results
3.1 Pure methanol ices
In this section, we analyse the vibrational spectra of pure methanol (CH3OH) and its isotopologues by combining targeted anharmonic calculations with existing experimental and theoretical studies to assess the effects of isotopic substitution. The observed spectral shifts and changes in mode coupling arise from the altered mass distribution and symmetry properties introduced by deuteration, which significantly modify both fundamental frequencies and the structure of overtone and combination manifolds. Our assignments are therefore guided by a unified framework in which newly computed anharmonic frequencies and intensities are evaluated alongside high-resolution infrared measurements and established ab initio results available in the literature (Falk & Whalley 1961; Karpfen 2011; Mukhopadhyay 2016b,a; Nagaoka et al. 2007; Scirè et al. 2019; Serrallach et al. 1974; Shimoaka & Katsumoto 2010). Tentative assignments for individual vibrational modes of each deuterated isotopologue are provided in the tables presented in the main text, while only the most relevant mid-infrared bands in the 2300–800 cm−1 region are summarised in the Appendix (Table A.1) as a focused reference for observational applications. Fig. 2 presents broadband transmission spectra of all studied isotopologues.
3.1.1 O − H stretch
In amorphous CH3OH ice, the O–H stretching band is observed at 3261 cm−1 (3.07 μm). Isotopologues with deuteration on the methyl group (CH2DOH, CHD2OH, and CD3OH) exhibit nearly identical O–H stretching bands at 3260–3263 cm−1 (≈ 3.07 µm), indicating that substitution in the methyl group does not significantly affect the O–H bond. In contrast, when the hydroxyl hydrogen is replaced – as in CH3OD and CD3OD – the O–D stretching band is shifted to lower frequencies, appearing at 2418 cm−1 (4.14 μm) and 2430 cm−1 (4.12 µm), respectively. This red–shift is consistent with the increased reduced mass of the O–D bond relative to the O–H bond. Computed fundamental ν(O–H) and ν(O–D) frequencies follow the same isotopic trends observed experimentally and support the assignment of the broad ice bands. Fig. 3 compares the infrared transmission spectra of pure methanol ice and its isotopologues in the O–H and O–D stretching region; Table 3 lists the band positions for the corresponding stretching modes.
3.1.2 C − H stretches
In pure CH3OH ice, the C–H stretching region is dominated by two prominent bands: an asymmetric stretch at 2953 cm−1 (3.39 µm) and a symmetric stretch at 2828 cm−1 (3.54 μm). These bands correspond to the fundamental C–H stretching modes of the methyl group and are in good agreement with both previous laboratory studies and the anharmonic calculations, which predict closely spaced symmetric and asymmetric C–H stretching fundamentals for solid methanol.
For CH3OD, the asymmetric C–H stretching appears split into two distinct peaks at 2954 cm−1 and 2912 cm−1 (3.39 μm and 3.43 μm), while the symmetric C–H stretch is observed at 2835 cm−1 (3.53 μm). Anharmonic calculations show that the fundamental C–H stretching frequencies are only marginally affected by deuteration at the hydroxyl position, suggesting that no additional C–H fundamental is expected. Instead, the extra feature observed experimentally is therefore most plausibly attributed to solid-state effects, such as site splitting and weak anharmonic mixing that lift near-degeneracies among closely spaced C–H stretching modes in the ice. Overall, deuteration at the hydroxyl position results in only minor perturbations of the C–H stretching manifold.
In CH2DOH, where deuteration occurs on the methyl group, the asymmetric C–H stretch shifts to 2936 cm−1 (3.41 μm) and the symmetric C–H stretch to 2879 cm−1 (3.47 μm). In addition, distinct C–D stretching bands emerge at 2242 cm−1 (4.46 μm), 2179 cm−1 (4.59 μm), and 2146 cm−1 (4.66 μm), providing a clear signature of deuteration. The origin of this triplet in the C–D stretching region has been discussed in terms of distinct ν(C–D) contributions from different conformers and local environments in the solid phase (including possible complexation), as discussed in detail by Shimoaka & Katsumoto (2010) and Scirè et al. (2019).
In CHD2OH, where two of the three methyl hydrogens are replaced by deuterium, only a single C−H stretching band remains, observed at 2913 cm−1 (3.43 μm). The CD2 stretching region displays asymmetric bands at 2222 cm−1 (4.50 μm) and 2180 cm−1 (4.59 μm), together with a symmetric band at 2126 cm−1 (4.70 μm). This progressive redistribution of intensity reflects the reduced number of C−H oscillators and the increasing dominance of C−D stretching modes.
Finally, in the fully deuterated isotopologues CD3OH and CD3OD, C−H stretching bands are absent, and the vibrational mode shifts entirely to the C−D stretching region: for CD3OH the asymmetric C−D stretch splits into two peaks at 2233 cm−1 (4.48 μm) and 2215 cm−1 (4.51 μm), while the symmetric C−D stretch appears at 2071 cm−1 (4.83 μm). CD3OD exhibits a similar pattern, with asymmetric C−D stretching bands at 2244 cm−1 (4.46 μm) and 2216 cm−1 (4.51 μm) and a symmetric C−D stretch at 2071 cm−1 (4.83 μm). Fig. 4 compares the infrared transmission spectra of pure methanol ice and its isotopologues in the C−H stretching region; Table 4 lists the corresponding band positions.
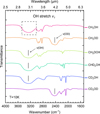 |
Fig. 3 Transmission spectra of solid methanol and its isotopologues recorded at 10 K, highlighting the O–H/O–D stretching region. For CH3OH, the dashed rectangle marks the O–H stretching band. The labels ν(O–H) and ν(O–D) denote the fundamental O–H and O–D stretching modes, respectively. Corresponding peak positions are listed in Table 3. Spectra are vertically offset for clarity. |
Fundamental hydroxyl stretches of solid methanol and its isotopologues at 10 K.
3.1.3 CH3 deformations
In pure CH3OH, the in-plane CH3 deformation is observed as a single broad band composed of several overlapping components, centred at 1461 cm−1 (6.84 μm). When the hydroxyl group is deuterated, as in CH3OD, the CH3 deformation splits into two components, appearing at 1470 cm−1 (6.80 μm) and 1445 cm−1 (6.92 μm).
For isotopologues where deuteration occurs on the methyl group, new features emerge. CH2DOH exhibits an in-plane CH2 deformation at 1464 cm−1 (6.83 μm) and a OCD bending at 919 cm−1 (10.88 μm). CHD2OH shows two C−H bending modes at 1329 cm−1 (7.52 μm) and 1301 cm−1 (7.69 μm), accompanied by a CD2 deformation band at 1088 cm−1 (9.19 μm). For fully deuterated species (CD3OH and CD3OD), the corresponding methyl deformations shift to lower frequencies, with the symmetric component appearing at approximately 1122 to 1123 cm−1 (≈ 8.91 μm) and the asymmetric component near 1062 to 1067 cm−1 (≈ 9.37 μm). Fig. 5 compares the transmission spectra of pure methanol ice and its isotopologues in the CH3 deformation region; Table 5 lists the corresponding band positions.
3.1.4 O−H bending
The O−H bending mode in CH3OH ice overlaps with the CH3 deformation features and appears as a broad and relatively weak band owing to strong hydrogen bonding among neighbouring molecules. For isotopologues with deuteration on the methyl group, the O−H bending mode remains blended with deformation features and appears near 1464 cm−1 (6.83 μm) in CH2DOH, at 1424 cm−1 (7.02 μm) in CHD2OH, and at 1398 cm−1 (7.15 μm) in CD3OH. In contrast, for isotopologues with substitution at the hydroxyl position—namely, CH3OD and CD3OD—the O−H bending mode is replaced by an O−D bending mode, observed at 942 cm−1 (10.62 μm) in CH3OD and at 1123 cm−1 (8.90 μm) in CD3OD. Fig. 6 compares the infrared transmission spectra of pure methanol ice and its isotopologues in the O−H bending region; Table 6 lists the corresponding band positions.
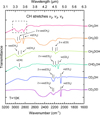 |
Fig. 4 Transmission spectra of solid methanol and its isotopologues recorded at 10 K, focusing on the C−H/C−D stretching region. For CH3OH, the dashed rectangle marks the C−H stretching bands. The stretching fundamentals are labelled vas and vs, with the vibrating group indicated in parentheses. The corresponding peak positions are listed in Table 4 Spectra are vertically offset for clarity. |
Fundamental C−H and C−D stretches of solid methanol and its isotopologues at 10 K.
3.1.5 CH3 rocking
In pure CH3OH ice, the CH3 rocking modes appear as two bands at 1158 cm−1 (8.64μm) and 1129 cm−1 (8.86 μm). For CH3OD, these modes are observed at 1161 cm−1 (8.61 μm) and 1123 cm−1 (8.90 μm), and an additional feature at 1234 cm−1 (8.10 μm) also appears (previously reported by Falk & Whalley 1961), suggesting a subtle shift due to coupling with the O−H bending vibration.
In CH2DOH, where deuteration occurs on the methyl group, the CH2 out-of-plane modes appear as a wagging band at 1326 cm−1 (7.54 μm), and a twisting band at 1293 cm−1 (7.73 μm). Two in-plane rocking components are observed at 1108 cm−1 (9.03 μm) and 1087 cm−1 (9.20 μm). In CHD2OH, these CH3-specific modes are no longer clearly visible, likely due to overlap with CD2 bending features.
Finally, among the highly deuterated isotopologues, the triply deuterated CD3OH exhibits a CD3 rocking mode at 898 cm−1 (11.14 μm), whereas the fully deuterated CD3OD shows two rocking bands at 900 cm−1 (11.11 μm) and 832 cm−1 (12.02 μm), consistent with Nagaoka et al. (2007). Fig. 7 compares the transmission spectra of pure methanol ice and its isotopologues in the CH3 rocking region; Table 7 lists the corresponding band positions.
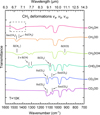 |
Fig. 5 Transmission spectra of solid methanol and its isotopologues recorded at 10 K, highlighting the CH3 deformation region. Modes are labelled δ for the in-plane bend. δas and δs denote the asymmetric and symmetric components, respectively, with the vibrating group given in parentheses. For CH3OH, the dashed rectangle marks the CH3 deformation region. Corresponding peak positions are listed in Table 5. Spectra are vertically offset for clarity. |
Methyl-group deformations of solid methanol and its isotopologues at 10 K.
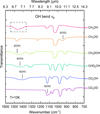 |
Fig. 6 Transmission spectra of solid methanol and its isotopologues recorded at 10 K, showing the O–H/O–D bending region. The bending fundamentals are labelled δ(OH) and δ(OD). For CH3OH, the dashed rectangle marks the O–H bending band. Corresponding peak positions are listed in Table 6. Spectra are vertically offset for clarity. |
Hydroxyl bending fundamentals of solid methanol and its isotopologues at 10 K.
3.1.6 C − O stretch
In pure CH3OH ice, the C–O stretching band is observed at 1031 cm−1 (9.70 μm). For hydroxyl-deuterated CH3OD, the C–O stretch remains unchanged at 1031 cm−1. Among the methyl-deuterated isotopologues, CHD2OH also exhibits the C–O stretching band at 1031 cm−1, whereas CH2DOH shows a modest shift to slightly higher wavenumber at 1036 cm−1 (9.65 μm). By contrast, a clear red-shift is observed for the more heavily deuterated isotopologues, with the C–O stretch appearing at 981 cm−1 (10.19 μm) in CD3OH and at 975 cm−1 (10.26 μm) in CD3OD. These values are consistent with previous vapour-phase observations (Falk & Whalley 1961) and indicate that substitution at the hydroxyl group or partial deuteration of the methyl group results in only small, non-systematic changes in the C–O stretching frequency, whereas extensive (≥3 H→D) substitution leads to a systematic shift towards lower frequencies. As with the O–H stretching region, the deposition conditions were adjusted to enhance saturation of the C–O band, thereby improving the detection of weaker mid-infrared and far-infrared features. Fig. 8 compares the transmission spectra of pure methanol ice and its isotopologues in the C–O stretching region; Table 8 lists the corresponding band positions.
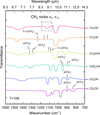 |
Fig. 7 Transmission spectra of solid methanol and its isotopologues recorded at 10 K, highlighting the methyl rocking region. Rocking (ρ), twisting (τ), and wagging (ω) modes are indicated, with the vibrating group given in parentheses. For CH3OH, the dashed rectangle marks the CH3 rocking bands. Corresponding peak positions are listed in Table 7. Spectra are vertically offset for clarity. |
Methyl rocking fundamentals of solid methanol and its isotopologues at 10 K.
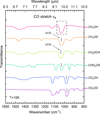 |
Fig. 8 Transmission spectra of solid methanol and its isotopologues recorded at 10 K, highlighting the C–O stretching region. The fundamental is labelled ν(C–O). For CH3OH, the dashed rectangle marks the C–O stretching band. Corresponding peak positions are listed in Table 8. Spectra are vertically offset for clarity. |
C–O stretching fundamental of solid methanol and its isotopologues at 10 K.
3.1.7 Torsion
In pure CH3OH ice, the torsional mode, which involves the internal rotation of the methyl group about the C–O bond, is observed at 710 cm−1 (14.1 μm). For isotopologues deuterated on the methyl group (CH2DOH, CHD2OH, and CD3OH), the torsional frequency remains close to that of CH3OH. In contrast, substitution at the hydroxyl position, as in CH3OD and CD3OD, results in a significant red–shift, with the torsional mode appearing at 520 cm−1 (19.2 μm) and 518 cm−1 (19.3 μm), respectively.
Weak lattice phonon features are already discernible in amorphous CH3OH ice at 10 K (≈ 307 cm−1 and ≈ 243 cm−1). After annealing to 120 K, the crystalline phase exhibits a well-resolved triplet at 348 cm−1, 293 cm−1, and 237 cm−1. The same three bands appear for every deuterated isotopologue, each shifting by no more than 10 cm−1 relative to CH3OH. A more detailed comparison of these torsional and lattice modes is provided in Appendix E. Fig. 9 compares the infrared transmission spectra of pure CH3OH ice and its isotopologues in the torsional region; Table 9 lists the corresponding band positions.
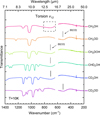 |
Fig. 9 Transmission spectra of solid methanol and its isotopologues recorded at 10 K, highlighting the methyl-torsion region. The torsional fundamental is labelled Φ(C−O). For CH3OH, the dashed rectangle marks the torsional band. Corresponding peak positions are listed in Table 9. Spectra are vertically offset for clarity. |
Torsional fundamental of solid methanol and its isotopologues at 10 K.
3.1.8 Overtone and combination bands
Fig. 10 compares the infrared transmission spectra of pure CH3OH ice and its isotopologues in the 2600 to 1900 cm−1 (3.85 to 5.26 μm) region, which is dominated by overtone and combination transitions. For isotopologues containing C–D bonds, this window also includes fundamental C–D stretching modes. Across all isotopologues, the dominant and most robust feature in this region is the first overtone of the C–O stretching mode, 2ν(CO), appearing between 1936 and 2051 cm−1 (5.17 and 4.86 µm) depending on isotopic substitution. Anharmonic calculations identify this transition as the strongest contributor in the overtone/combination window. All other features arise from clusters of weak, strongly mixed combination bands involving C–O stretching, hydroxyl bending, and methyl or deuterated-group deformations. These bands are intrinsically weak, broadened by solid-state effects, and vary in relative intensity among isotopologues and are therefore not expected to provide primary astrophysical diagnostics. Tabulated summaries of these bands are provided in Appendix D, where near-infrared positions are compared with literature data from Grabska et al. (2017) and mid-infrared assignments are guided by the anharmonic calculations presented in this work. Owing to the weak intensities and strong mode mixing in this region, a complete assignment of all contributing transitions is beyond the scope of the present study.
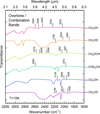 |
Fig. 10 Transmission spectra of solid methanol and its isotopologues recorded at 10 K, showing combination and overtone bands. Spectra are vertically offset for clarity. |
3.2 Astrophysical ices: Binary mixtures and H2O- and CO-rich matrices
In this section, we compare the infrared transmission spectra of different astrophysical ice mixtures for each deuterated methanol isotopologue, focusing on the frequency window between 2300 to 800 cm−1 (4.35 to 12.50 μm). This range was selected for several reasons. First, it corresponds to the spectral coverage of JWST/MIRI. Second, it includes vibrational regions where deuteration introduces characteristic spectral changes—namely, the appearance of shifted C–D stretching modes between 2300 to 2000 cm−1 (4.35 to 5 μm) and shifted CH3 deformation modes between 1500 to 800 cm−1 (6.66 to 12.5 μm).
All spectra were recorded after deposition at 10 K. Each subsection presents the spectral data in four environments: pure methanol ice, a binary mixture, an H2O matrix, and a CO matrix (see Table 1). The key vibrational features of each isotopologue are highlighted under these distinct astrophysical conditions.
At the end of each subsection, a summary table lists the highlighted band positions, facilitating comparison across different environments. Notably, the characteristic bands of the deuterated species exhibit only minor frequency shifts, within the experimental uncertainty, indicating that their fundamental vibrational modes are largely unaffected by the surrounding matrix composition.
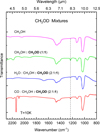 |
Fig. 11 Transmission spectra of pure methanol ice and deuterated methanol (CH3OD) embedded in three astrophysical ice matrices at 10 K. Key vibrational features associated with deuteration are marked by vertical dashed lines; their centres vary within 1 cm−1 across the matrices (see Table 10). Spectra are vertically offset for clarity. |
Deuterated vibrational modes of CH3OD in astrophysical ice mixtures at 10 K in the mid-infrared region.
3.2.1 CH3OD mixtures
For ice mixtures containing CH3OD, a characteristic CH3-rocking band appears at 1234 cm−1 (8.10 μm) in both the binary and H2O-rich mixtures. In the CO-rich ice, this feature shifts marginally to 1233 cm−1 (8.11 μm). This band is absent in pure CH3OH ice and therefore serves as a clear spectroscopic marker of CH3OD that is preserved across the different ice environments. The observed variation in peak position is limited to 1 cm−1 and thus lies within the experimental uncertainty. Fig. 11 shows the transmission spectra of CH3OD-containing mixtures overlaid with that of pure methanol ice, illustrating the spectral change introduced by deuteration; Table 10 summarises the frequencies of the key deuterated bands highlighted in the figure for each matrix.
3.2.2 CH2DOH mixtures
For ice mixtures containing CH2DOH, a characteristic doublet is observed in the binary ice at 1326 cm−1 (7.54 μm, CH2 wag) and 1293 cm−1 (7.73 μm, CH2 twist). In the H2O-rich ice, these bands shift slightly to 1329 cm−1 (7.52 μm) and 1294 cm−1 (7.73 μm), respectively, while in the CO-rich ice they appear at 1325 cm−1 (7.55 μm) and 1293 cm−1 (7.73 μm). The C–D stretching mode is located at 2179 cm−1 (4.59 μm) in the binary mixture, shifting to 2183 cm−1 (4.58 μm) in the H2O matrix and to 2181 cm−1 (4.59 μm) in the CO matrix. A weaker OCD bending mode is observed at 919 cm−1 (10.88 μm) in the binary ice, shifting to 917 cm−1 (10.90 μm) in the H2O-rich mixture and to 920 cm−1 (10.87 μm) in the CO-rich mixture. All observed shifts are within a few cm−1 and thus lie within the overall experimental uncertainty. Fig. 12 shows the transmission spectra of CH2DOH-containing mixtures overlaid with that of pure methanol ice, allowing comparison of the spectral changes induced by deuteration; Table 11 summarises the frequencies of the key deuterated bands highlighted in the figure for each matrix.
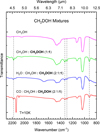 |
Fig. 12 Transmission spectra of pure methanol ice and deuterated methanol (CH2DOH) embedded in three astrophysical ice matrices at 10 K. Key vibrational features associated with deuteration are marked by vertical dashed lines; their centres vary by 1–4 cm−1 across the matrices (see Table 11). Spectra are vertically offset for clarity. |
Deuterated vibrational modes of CH2DOH in astrophysical ice mixtures at 10 K in the mid-infrared region.
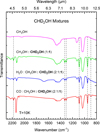 |
Fig. 13 Transmission spectra of pure methanol ice and deuterated methanol (CHD2OH) embedded in three astrophysical ice matrices at 10 K. Key vibrational features associated with deuteration are marked by vertical dashed lines; their centres vary within 1–2 cm−1 across the matrices (see Table 12). Spectra are vertically offset for clarity. |
3.2.3 CHD2OH mixtures
For ice mixtures containing CHD2OH, the transmission spectra show a set of well-defined deuteration-induced features that are preserved across all environments. A characteristic doublet is present in the binary mixture at 1329 cm−1 (7.52 μm, C−H bend) and 1304 cm−1 (7.67 μm, C−H bend). In the H2O-rich ice, these bands shift slightly to 1330 cm−1 (7.52 μm) and 1305 cm−1 (7.66 μm), whereas in the CO-rich ice they are observed at 1329 cm−1 (7.52 μm) and 1304 cm−1 (7.67 μm), respectively. The CD2 asymmetric stretch at 2180 cm−1 (4.59 μm) in the binary mixture shifts marginally to 2181 cm−1 (4.59 μm) in the H2O matrix and remains at 2180 cm−1 (4.59 μm) in the CO matrix.
Lower-frequency CD2 modes are likewise conserved. The CD2 bend at 1087 cm−1 (9.20 μm) is unchanged in the binary and H2O ices and shifts to 1088 cm−1 (9.19 μm) in the CO ice. The CD2 wag at 950 cm−1 (10.53 μm) in the binary and H2O ices moves to 949 cm−1 (10.54 μm) in the CO ice, while the CD2 twist at 894 cm−1 (11.19 μm) in the binary ice appears at 893 cm−1 (11.20 μm) in both mixed matrices. All observed shifts are within 1 to 2 cm−1, consistent with the experimental uncertainty. Fig. 13 shows the transmission spectra of CHD2OH- containing mixtures overlaid with that of pure methanol ice, illustrating deuteration-induced spectral changes; Table 12 summarises the frequencies of the key deuterated bands highlighted in the figure for each matrix.
3.2.4 CD3OH mixtures
For ice mixtures containing CD3OH, the transmission spectra reveal a consistent set of deuteration-induced features across the different environments. In CD3OH ices, the C−O stretching band appears at 982 cm−1 (10.18 μm) in the binary mixture, shifting marginally to 981 cm−1 (10.19 μm) in the H2O-rich ice and to 983 cm−1 (10.17 μm) in the CO-rich ice. The CD3 symmetric stretching mode is observed at 2072 cm−1 (4.82 μm) in the binary mixture, moving to 2075 cm−1 (4.82 μm) in the H2O matrix and to 2074 cm−1 (4.82 μm) in the CO matrix.
The CD3 asymmetric bending mode occurs at 1068 cm−1 (9.36 μm) in the binary ice and shifts slightly to 1069 cm−1 (9.35 μm) in the H2O mixture and to 1070 cm−1 (9.35 μm) in the CO mixture. The CD3 rocking mode is located at 899 cm−1 (11.12 μm) in the binary ice, at 903 cm−1 (11.07 μm) in the H2O- rich mixture, and again at 899 cm−1 (11.12 μm) in the CO-rich ice. The observed variations in peak positions are limited to a few cm−1 and therefore fall within the overall experimental uncertainty. Fig. 14 shows the transmission spectra of CD3OH- containing mixtures overlaid with that of pure methanol ice, enabling direct comparison of the spectral changes introduced by deuteration; Table 13 summarises the frequencies of the key deuterated bands highlighted in the figure for each matrix.
Deuterated vibrational modes of CHD2OH in astrophysical ice mixtures at 10 K in the mid-infrared region.
3.2.5 CD3OD mixtures
In CD3OD-containing ices, the overall spectral pattern closely resembles that observed for CD3OH. The CD3 symmetric stretching mode appears at 2072 cm−1 (4.82 μm) in the binary mixture and shifts marginally to 2074 cm−1 (4.82 μm) in both the H2O- and CO-rich matrices. The CD3 asymmetric bending mode is observed at 1066 cm−1 (9.38 μm) in the binary ice, shifts to 1068 cm−1 (9.36 μm) in the H2O matrix, and returns to 1066 cm−1 (9.38 μm) in the CO matrix. The shifted C−O stretching band is located at 979 cm−1 (10.21 μm) in both the binary and H2O-rich ices and at 980 cm−1 (10.20 μm) in the CO-rich ice.
Lower-frequency modes are likewise stable across all environments. The CD3 rocking mode remains at 899 cm−1 (11.12 μm) in all mixtures, while a second CD3 rocking mode is observed at 836 cm−1 (11.96 μm) in the binary and H2O-rich ices and at 834 cm−1 (11.99 μm) in the CO-rich ice. All observed shifts are at the level of a few cm−1 and fall within the overall experimental uncertainty.
A weak feature at 1234 cm−1 (8.10 μm) is present in spectra of both pure and mixed CD3OD ices. This feature is attributed to trace contamination in the original CD3OD sample and is therefore excluded from the band assignments discussed here.
Overall, the characteristic deuteration-induced spectral features of CD3OD appear to be preserved across the different astrophysical ice mixtures, with only minor variations comparable to the experimental uncertainty. Fig. 15 shows the transmission spectra of CD3OD-containing mixtures overlaid with that of pure methanol ice, enabling direct comparison of the spectral features associated with deuteration; Table 14 summarises the frequencies of the key deuterated bands highlighted in the figure for each matrix.
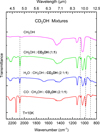 |
Fig. 14 Transmission spectra of pure methanol ice and deuterated methanol (CD3OH) embedded in three astrophysical ice matrices at 10 K. Key vibrational features associated with deuteration are marked by vertical dashed lines; their centres vary within 1–3 cm−1 across the matrices (see Table 13). Spectra are vertically offset for clarity. |
Deuterated vibrational modes of CD3OH in astrophysical ice mixtures at 10 K in the mid-infrared region.
4 Discussion
Deuterated methanol is an exceptionally sensitive probe of grain-surface chemistry in the cold interstellar medium. While the elemental D/H ratio in the local ISM is (2.0 ± 0.1) × 10−5 (Vidal-Madjar 2002; Linsky et al. 2006; Prodanović et al. 2010), the molecular D/H ratio in methanol can be enhanced by several orders of magnitude in star-forming regions. Towards the Class 0 protostar IRAS 16293−2422, the abundance ratio [CH2DOH]/[CH3OH] reaches 0.9 ± 0.3 (Parise et al. 2002), and even Solar System material such as comet 67P/Churyumov–Gerasimenko shows a significantly enhanced total monodeuterated methanol fraction, ([CH2DOH] + [CH3OD])/[CH3OH] = 0.055 ± 0.005, corresponding to an upper limit estimate (Drozdovskaya et al. 2020). Singly, doubly, and triply deuterated isotopologues (CH2DOH, CHD2OH, CD3OH) have been detected in prestellar cores and hot corino sources (Parise et al. 2004, 2006; Bizzocchi et al. 2014; Bianchi et al. 2017; Manigand et al. 2019; Lin et al. 2023; Spezzano et al. 2025), confirming that deuterium is incorporated efficiently into methanol ices at 10–20 K and that methanol deuteration predominantly traces cold prestellar conditions (Ceccarelli et al. 2014; Caselli & Ceccarelli 2012; Bianchi et al. 2017).
Methanol itself is formed almost exclusively on dust grains through successive H-atom additions to CO ice (Watanabe & Kouchi 2002; Fuchs et al. 2009). This hydrogenation network is among the best constrained in astrochemistry thanks to extensive laboratory and theoretical work (Osamura et al. 2004; Nagaoka et al. 2005; Hidaka et al. 2009; Chuang et al. 2015). Gas–grain models reproduce the large abundances of CH2DOH, CHD2OH, and CD3OH once the atomic D/H ratio in the gas phase climbs to ∼0.1–0.2 after catastrophic CO freeze-out (Taquet et al. 2012; Caselli et al. 2022). By contrast, the hydroxyl-deuterated isotopologue CH3OD is systematically underabundant relative to CH2DOH in protostellar sources and hot corinos (Parise et al. 2006; Jørgensen et al. 2018; Manigand et al. 2019). Proposed explanations include (i) kinetic and energetic preferences for H abstraction and addition during surface hydrogenation (Nagaoka et al. 2005); (ii) post-desorption destruction of CH3OD through gas-phase proton-transfer cycles (Charnley et al. 1997; Sipilä et al. 2015); and (iii) selective H/D exchange with H2O or NH3 ices that removes D from the hydroxyl group (Kawanowa et al. 2004; Ratajczak et al. 2009; Lamberts et al. 2015; Faure et al. 2015). Because the hydroxyl group readily participates in hydrogen bonding, such exchange reactions may partially erase the original deuteration signature at the OH site, complicating direct links between CH3OD abundances and formation pathways. The persistent CH3OD deficit therefore offers an additional constraint on the physical history and post-formation processing of interstellar ices.
Laboratory experiments and theoretical studies further indicate that the dominant formation pathways of singly and doubly deuterated methanol differ in their sensitivity to the timing of deuterium availability on grain surfaces. Monodeuterated methanol (CH2DOH) is thought to form predominantly through H–D substitution reactions in pre-existing methanol, following abstraction of an H atom from the methyl group and subsequent D addition. This mechanism is efficient at ∼10–20 K and strongly favours methyl deuteration over hydroxyl substitution, owing to both kinetic barriers and reaction energetics (Osamura et al. 2004; Nagaoka et al. 2005, 2007; Goumans & Kästner 2011). In contrast, doubly deuterated methanol (CHD2OH) is more readily produced earlier in the CO hydrogenation sequence, via H–D substitution reactions in formaldehyde (HDCO, D2CO) followed by further hydrogenation to methanol (Hidaka et al. 2009; Chuang et al. 2015). These distinct pathways imply that the relative abundances of CH2DOH and CHD2OH reflect not only the atomic D/H ratio in the accreting gas, but also the temporal overlap between CO hydrogenation and deuterium enrichment on grain surfaces (Aikawa et al. 2012; Taquet et al. 2014). The simultaneous presence of both isotopologues therefore supports scenarios in which hydrogenation and deuteration proceed simultaneously during the cold prestellar phase, rather than in strictly sequential stages, in agreement with laboratory constraints and gas–grain chemical models (Taquet et al. 2012; Ceccarelli et al. 2014; Drozdovskaya et al. 2020).
Beyond serving as a diagnostic tool, methanol is a key precursor to complex organic molecules (COMs). UV or thermal processing of CH3OH ices liberates radicals (e.g. CH3, CH3O, CH2OH) that drive COM formation (Öberg et al. 2009; Bertin et al. 2016). Laboratory studies demonstrate that deuterium initially stored in CH2DOH or CH3OD can be transferred to COMs, and that the efficiency depends on whether the donor is the methyl or the hydroxyl site (Oba et al. 2017). Since methanol deuteration is largely established during the cold prestellar phase and is expected to be halted above ∼20 K, the isotopic composition of methanol provides a fossil record of early ice chemistry that may be partially inherited by more complex species. An accurate inventory of deuterium among methanol isotopologues is therefore essential for interpreting ongoing JWST and ALMA surveys of deuterated COMs.
High-resolution infrared spectra obtained in our experiments for amorphous methanol ices at 10 K and for partially crystalline ices after annealing to 120 K reveal several stable diagnostic features across all methanol isotopologues, studied both in pure form and in H2O- and CO-rich matrices representative of interstellar ice environments. A key spectroscopic signature is the characteristic doublet observed in the bending region of singly and doubly deuterated methanol: CH2DOH exhibits a well-separated pair at 1326 and 1293 cm−1(7.54 and 7.73 μm), while CHD2OH shows a corresponding double feature at 1329 and 1301 cm−1 (7.52 and 7.69 μm). These splittings persist across different ice matrices and temperatures, with only minor shifts at the level of the experimental uncertainty, supporting their use as reliable spectral fingerprints for identifying methanol isotopologues in astronomical ice spectra and for tracing prestellar ice compositions into later evolutionary stages.
Our measurements span two representative temperature regimes: a low-temperature regime at 10 K and a high-temperature regime after annealing to 120 K. The 10 K spectra probe conditions characteristic of cold interstellar ices in dense molecular clouds and prestellar cores, where methanol and its isotopologues are thought to form on grain surfaces and where methanol is predominantly observed in the solid phase. In addition to these endpoint measurements, a limited set of intermediate-temperature annealing experiments was performed between 10 and 120 K, revealing only modest band shifts below the crystallisation temperature. The most pronounced spectral changes occur upon annealing to 120 K, where methanol undergoes a pronounced phase transition from amorphous to crystalline ice, leading to systematic frequency shifts and band sharpening that dominate the spectral evolution. Such temperatures are relevant to later stages of star formation, when interstellar ices experience substantial thermal processing in warm protostellar environments prior to sublimation. While the present data provide robust reference spectra at these two temperature limits, extrapolation to intermediate temperatures should be treated with caution, particularly during gradual warm-up phases where partial ice restructuring, segregation, or isotope exchange processes may occur.
To facilitate comparison with astronomical observations, the experimental mixing ratios were chosen to reproduce the maximum observed CH2DOH abundance ([CH2DOH]/[CH3OH] ∼ 1) and a lower limit set by experimental sensitivity ([CH2DOH]/[CH3OH] ∼ 0.1). In addition, theoretical models by Riedel et al. (2023) suggest that deuteration can be efficient enough for singly deuterated methanol to exceed its parent species in abundance. We therefore performed a third set of experiments exploring the case [CH2DOH]/[CH3OH] > 1. All other isotopologues were assigned the same mixing ratio as CH2DOH in these experiments.
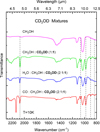 |
Fig. 15 Transmission spectra of pure methanol ice and deuterated methanol (CD3OD) embedded in three astrophysical ice matrices at 10 K. Key vibrational features associated with deuteration are marked by vertical dashed lines; their centres vary within 1–2 cm−1 across the matrices (see Table 14). Spectra are vertically offset for clarity. |
Deuterated vibrational modes of CD3OD in astrophysical ice mixtures at 10 K in the mid-infrared region.
5 Conclusions
We have presented a systematic laboratory investigation of the infrared spectra of solid methanol and its five main isotopologues. Reliable band positions and tentative vibrational assignments across the near-, mid-, and far-infrared are established for the pure methanol isotopologues, supported by complementary anharmonic vibrational calculations and additional spectra recorded after annealing to 120 K. The behaviour of deuteration-induced bands in the mid-infrared is examined in binary, CO-rich, and H2O-rich ice mixtures at 10 K. For all isotopologues, the deuteration-induced bands are largely preserved, with only minor matrix-dependent shifts that remain within the experimental uncertainty. The resulting dataset comprises a coherent laboratory reference for the identification of deuterated methanol isotopologues in interstellar ices and supports the interpretation of current and forthcoming infrared observations, including those from JWST. A quantitative determination of integrated band strengths and their dependence on temperature and ice composition remains an important objective for future work.
Data availability
All laboratory spectra acquired during this study are openly available at https://doi.org/10.5281/zenodo.18257625.
Acknowledgements
This work was supported by the Max Planck Society. We thank Christian Deysenroth and his team for designing and developing the experimental setup and for their continuous assistance in laboratory development. This article is based on work from the COST Action CA20129 – Multiscale Irradiation and Chemistry Driven Processes and Related Technologies (MultIChem) and COST Action CA22133 – The Birth of Solar Systems (PLANETS), supported by COST (European Cooperation in Science and Technology).
References
- Aikawa, Y., Wakelam, V., Hersant, F., Garrod, R. T., & Herbst, E. 2012, ApJ, 760, 40 [NASA ADS] [CrossRef] [Google Scholar]
- Baratta, G. A., & Palumbo, M. E. 1998, J. Opt. Soc. Am. A, 15, 3076 [Google Scholar]
- Barone, V. 2005, J. Chem. Phys., 122, 014108 [Google Scholar]
- Bertin, M., Romanzin, C., Doronin, M., et al. 2016, ApJL, 817, L12 [Google Scholar]
- Bianchi, E., Codella, C., Ceccarelli, C., et al. 2017, A&A, 606, L7 [NASA ADS] [CrossRef] [EDP Sciences] [Google Scholar]
- Bizzocchi, L., Caselli, P., Spezzano, S., & Leonardo, E. 2014, A&A, 569, A27 [NASA ADS] [CrossRef] [EDP Sciences] [Google Scholar]
- Brunken, N. G. C., Rocha, W. R. M., van Dishoeck, E. F., et al. 2024, A&A, 685, A27 [NASA ADS] [CrossRef] [EDP Sciences] [Google Scholar]
- Caselli, P. 2002, Planet. Space Sci., 50, 1133 [NASA ADS] [CrossRef] [Google Scholar]
- Caselli, P., & Ceccarelli, C. 2012, Astron. Astrophys. Rev., 20 [Google Scholar]
- Caselli, P., van der Tak, F. F. S., Ceccarelli, C., & Bacmann, A. 2003, A&A, 403, L37 [CrossRef] [EDP Sciences] [Google Scholar]
- Caselli, P., Pineda, J. E., Sipilä, O., et al. 2022, ApJ, 929, 13 [NASA ADS] [CrossRef] [Google Scholar]
- Ceccarelli, C., Caselli, P., Bockelée-Morvan, D., et al. 2014, Deuterium Fractionation: The Ariadne’s Thread from the Precollapse Phase to Meteorites and Comets Today (University of Arizona Press) [Google Scholar]
- Chacón-Tanarro, A., Caselli, P., Bizzocchi, L., et al. 2019, A&A, 622, A141 [Google Scholar]
- Charnley, S. B., Tielens, A. G. G. M., & Rodgers, S. D. 1997, ApJ, 482, L203 [NASA ADS] [CrossRef] [Google Scholar]
- Chuang, K.-J., Fedoseev, G., Ioppolo, S., van Dishoeck, E., & Linnartz, H. 2015, MNRAS, 455, 1702 [Google Scholar]
- Cuppen, H. M., Linnartz, H., & Ioppolo, S. 2024, Annu. Rev. Astron. Astrophys., 62, 243 [Google Scholar]
- Dartois, E., Noble, J. A., Caselli, P., et al. 2024, Nat. Astron., 8, 359 [NASA ADS] [CrossRef] [Google Scholar]
- Dickers, M. D., Mifsud, D. V., Mason, N. J., & Fantuzzi, F. 2025, Space Sci. Rev., 221, 106 [Google Scholar]
- Dinu, D. F., Oenen, K., Schlagin, J., et al. 2024, ACS Phys. Chem. Au, 4, 679 [Google Scholar]
- Drozdovskaya, M. N., Schroeder I, I. R. H. G., Rubin, M., et al. 2020, MNRAS, 500, 4901 [CrossRef] [Google Scholar]
- Dunning, T. H. 1989, J. Chem. Phys., 90, 1007 [Google Scholar]
- Falk, M., & Whalley, E. 1961, J. Chem. Phys., 34, 1554 [Google Scholar]
- Faure, A., Faure, M., Theulé, P., Quirico, E., & Schmitt, B. 2015, A&A, 584, A98 [NASA ADS] [CrossRef] [EDP Sciences] [Google Scholar]
- Frisch, M. J., Trucks, G. W., Schlegel, H. B., et al. 2016, Gaussian 16, Revision C.01 (Wallingford CT: Gaussian, Inc.) [Google Scholar]
- Fuchs, G. W., Cuppen, H. M., Ioppolo, S., et al. 2009, A&A, 505, 629 [NASA ADS] [CrossRef] [EDP Sciences] [Google Scholar]
- Giuliano, B. M., Escribano, R. M., Martín-Doménech, R., Dartois, E., & Muñoz Caro, G. M. 2014, A&A, 565, A108 [NASA ADS] [CrossRef] [EDP Sciences] [Google Scholar]
- Giuliano, B. M., Martín-Doménech, R., Escribano, R. M., Manzano-Santamaría, J., & Muñoz Caro, G. M. 2016, A&A, 592, A81 [NASA ADS] [CrossRef] [EDP Sciences] [Google Scholar]
- Giuliano, B. M., Gavdush, A. A., Müller, B., et al. 2019, A&A, 629, A112 [NASA ADS] [CrossRef] [EDP Sciences] [Google Scholar]
- Goto, M., Vasyunin, A. I., Giuliano, B. M., et al. 2021, A&A, 651, A53 [NASA ADS] [CrossRef] [EDP Sciences] [Google Scholar]
- Goumans, T. P. M., & Kästner, J. 2011, J. Phys. Chem. A, 115, 10767 [Google Scholar]
- Grabska, J., Czarnecki, M. A., Beć, K. B., & Ozaki, Y. 2017, J. Phys. Chem. A, 121, 7925 [Google Scholar]
- Grimme, S. 2006, J. Chem. Phys., 124, 034108 [Google Scholar]
- Hänninen, V., & Halonen, L. 2003, Mol. Phys., 101, 2907 [Google Scholar]
- Hidaka, H., Watanabe, M., Kouchi, A., & Watanabe, N. 2009, ApJ, 702, 291 [NASA ADS] [CrossRef] [Google Scholar]
- Jørgensen, J. K., Müller, H. S. P., Calcutt, H., et al. 2018, A&A, 620, A170 [Google Scholar]
- Jørgensen, J. K., Belloche, A., & Garrod, R. T. 2020, Annu. Rev. Astron. Astrophys., 58, 727 [Google Scholar]
- Karpfen, A. 2011, Phys. Chem. Chem. Phys., 13, 14194 [Google Scholar]
- Kawanowa, H., Kondo, M., Gotoh, Y., & Souda, R. 2004, Surf. Sci., 566, 1190 [CrossRef] [Google Scholar]
- Kendall, R. A., Dunning, T. H., & Harrison, R. J. 1992, J. Chem. Phys., 96, 6796 [NASA ADS] [CrossRef] [Google Scholar]
- Lamberts, T., Ioppolo, S., Cuppen, H. M., Fedoseev, G., & Linnartz, H. 2015, MNRAS, 448, 3820 [NASA ADS] [CrossRef] [Google Scholar]
- Ligterink, N. F. W., Walsh, C., Bhuin, R. G., et al. 2018, A&A, 612, A88 [NASA ADS] [CrossRef] [EDP Sciences] [Google Scholar]
- Lin, Y., Spezzano, S., & Caselli, P. 2023, A&A, 669, L6 [NASA ADS] [CrossRef] [EDP Sciences] [Google Scholar]
- Linnartz, H., Ioppolo, S., & Fedoseev, G. 2015, Int. Rev. Phys. Chem., 34, 205 [Google Scholar]
- Linsky, J. L., Draine, B. T., Moos, H. W., et al. 2006, ApJ, 647, 1106 [Google Scholar]
- Manigand, S., Calcutt, H., Jørgensen, J. K., et al. 2019, A&A, 623, A69 [NASA ADS] [CrossRef] [EDP Sciences] [Google Scholar]
- McClure, M. K., Rocha, W. R. M., Pontoppidan, K. M., et al. 2023, Nat. Astron., 7, 431 [NASA ADS] [CrossRef] [Google Scholar]
- Minissale, M., Dulieu, F., Cazaux, S., & Hocuk, S. 2015, A&A, 585, A24 [Google Scholar]
- Moruzzi, G. 2018, Microwave, Infrared, and Laser Transitions of Methanol Atlas of Assigned Lines from 0 to 1258 cm-1 (Boca Raton, FL, USA: CRC Press), 543 [Google Scholar]
- Mukhopadhyay, I. 2016a, Infrared Phys. Technol., 75, 145 [Google Scholar]
- Mukhopadhyay, I. 2016b, Infrared Phys. Technol., 76, 82 [Google Scholar]
- Müller, B., Giuliano, B. M., Vasyunin, A., Fedoseev, G., & Caselli, P. 2022, A&A, 668, A46 [NASA ADS] [CrossRef] [EDP Sciences] [Google Scholar]
- Nagaoka, A., Watanabe, N., & Kouchi, A. 2005, ApJ, 624, L29 [NASA ADS] [CrossRef] [Google Scholar]
- Nagaoka, A., Watanabe, N., & Kouchi, A. 2007, J. Phys. Chem. A, 111, 3016 [NASA ADS] [CrossRef] [Google Scholar]
- Oba, Y., Takano, Y., Naraoka, H., Kouchi, A., & Watanabe, N. 2017, ApJ, 849, 122 [Google Scholar]
- Öberg, K. I., Garrod, R. T., van Dishoeck, E. F., & Linnartz, H. 2009, A&A, 504, 891 [NASA ADS] [CrossRef] [EDP Sciences] [Google Scholar]
- Osamura, Y., Roberts, H., & Herbst, E. 2004, A&A, 421, 1101 [NASA ADS] [CrossRef] [EDP Sciences] [Google Scholar]
- Palumbo, M., Urso, R., Kaňuchová, Z., et al. 2015, EAS Publ. Ser., 75, 309 [Google Scholar]
- Parise, B., Ceccarelli, C., Tielens, A. G. G. M., et al. 2002, A&A, 393, L49 [NASA ADS] [CrossRef] [EDP Sciences] [Google Scholar]
- Parise, B., Castets, A., Herbst, E., et al. 2004, A&A, 416, 159 [NASA ADS] [CrossRef] [EDP Sciences] [Google Scholar]
- Parise, B., Ceccarelli, C., Tielens, A. G. G. M., et al. 2006, A&A, 453, 949 [NASA ADS] [CrossRef] [EDP Sciences] [Google Scholar]
- Prodanović, T., Steigman, G., & Fields, B. D. 2010, MNRAS, 1108 [Google Scholar]
- Punanova, A., Vasyunin, A., Caselli, P., et al. 2022, ApJ, 927, 213 [CrossRef] [Google Scholar]
- Quitián-Lara, H. M., Fantuzzi, F., Mason, N. J., & Boechat-Roberty, H. M. 2024, MNRAS, 527, 10294 [Google Scholar]
- Ratajczak, A., Quirico, E., Faure, A., Schmitt, B., & Ceccarelli, C. 2009, A&A, 496, L21 [NASA ADS] [CrossRef] [EDP Sciences] [Google Scholar]
- Riedel, W., Sipilä, O., Redaelli, E., et al. 2023, A&A, 680, A87 [NASA ADS] [CrossRef] [EDP Sciences] [Google Scholar]
- Rocha, W. R. M., Rachid, M. G., Olsthoorn, B., et al. 2022, A&A, 668, A63 [NASA ADS] [CrossRef] [EDP Sciences] [Google Scholar]
- Rocha, W. R. M., van Dishoeck, E. F., Ressler, M. E., et al. 2024, A&A, 683, A124 [NASA ADS] [CrossRef] [EDP Sciences] [Google Scholar]
- Rocha, W. R. M., McClure, M. K., Sturm, J. A., et al. 2025, A&A, 693, A288 [NASA ADS] [CrossRef] [EDP Sciences] [Google Scholar]
- Scirè, C., Urso, R., Fulvio, D., Baratta, G., & Palumbo, M. 2019, Spectrochim. Acta A, 219, 288 [Google Scholar]
- Serrallach, A., Meyer, R., & Günthard, H. 1974, J. Mol. Spectrosc., 52, 94 [Google Scholar]
- Shimoaka, T., & Katsumoto, Y. 2010, J. Phys. Chem. A, 114, 11971 [Google Scholar]
- Sipilä, O., Caselli, P., & Harju, J. 2015, A&A, 578, A55 [Google Scholar]
- Spezzano, S., Riedel, W., Caselli, P., et al. 2025, High deuteration of methanol in L1544 [Google Scholar]
- Sturm, J. A., McClure, M. K., Beck, T. L., et al. 2023, A&A, 679, A138 [NASA ADS] [CrossRef] [EDP Sciences] [Google Scholar]
- Taquet, V., Ceccarelli, C., & Kahane, C. 2012, ApJ, 748, L3 [Google Scholar]
- Taquet, V., Charnley, S. B., & Sipilä, O. 2014, ApJ, 791, 1 [NASA ADS] [CrossRef] [Google Scholar]
- Teixeira, F., & Cordeiro, M. N. D. S. 2019, J. Chem. Theory Comput., 15, 456 [Google Scholar]
- Tyagi, H., Manoj, P., Narang, M., et al. 2025, ApJ, 983, 110 [Google Scholar]
- Urso, R. G., Palumbo, M. E., Baratta, G. A., et al. 2018, MNRAS, 479, 130 [Google Scholar]
- van Gelder, M. L., Francis, L., van Dishoeck, E. F., et al. 2024, A&A, 692, A197 [NASA ADS] [CrossRef] [EDP Sciences] [Google Scholar]
- Vasyunin, A. I., Caselli, P., Dulieu, F., & Jiménez-Serra, I. 2017, ApJ, 842, 33 [Google Scholar]
- Vidal-Madjar, A. 2002, Planet. Space Sci., 50, 1161 [Google Scholar]
- Walmsley, C. M., Flower, D. R., & Pineau des Forêts, G. 2004, A&A, 418, 1035 [NASA ADS] [CrossRef] [EDP Sciences] [Google Scholar]
- Watanabe, N., & Kouchi, A. 2002, ApJ, 571, L173 [Google Scholar]
Appendix A Mid-infrared bands of methanol isotopologues
The vibrational bands of solid methanol and its isotopologues in the 2300 to 800 cm−1 (4.35 to 12.5 μm) mid-infrared region are summarised here. This spectral range encompasses C−D stretching modes, CH3 deformation modes, O−H/O−D bending vibrations, rocking motions, as well as twisting and wagging modes, together with the C−O stretching band. Collectively, these features provide some of the most diagnostically relevant spectral signatures of methanol-bearing interstellar ices. The bands compiled in Table A.1 are extracted from the laboratory dataset presented in the main text and are intended as a concise, observation-oriented reference. Notable examples include the characteristic doublet of CH2DOH at 1293 and 1326 cm−1 (7.73 and 7.54 μm) and the analogous doublet of CHD2OH at 1301 and 1329 cm−1 (7.69 and 7.52 μm). In astronomical spectra, these features may be affected by continuum placement, silicate absorption in the ~10 μm region, and potential overlap with the CH4 band near 7.7 μm. Their identification may therefore require careful analysis, particularly as a function of ice composition and relative molecular abundances. All band positions reported here correspond to amorphous ices deposited at 10 K. Band assignments remain tentative in spectral regions where multiple bending and deformation modes overlap. A more complete overview of the vibrational modes observed in this study, including the stretching and torsional regions, is provided in the tables and figures presented in Sect. 3.
Mid-infrared vibrational modes of amorphous methanol ice (CH3OH) and its isotopologues between 2300 and 800 cm–1 at 10 K.
Appendix B Pure ice isotopologue spectra at 120 K
We present transmission spectra of pure methanol ice (CH3OH) and its five isotopologues obtained from the same samples shown in Fig. 2 after warming up from 10 K to 120 K at a rate of 1–2 K min−1. Compared to the 10 K spectra, the 120 K data (Fig. B.1) show pronounced band sharpening, the appearance of band splittings, and small shifts in peak positions, typically limited to 5–10 cm−1, across the principal vibrational modes. These spectral changes are consistent with crystallisation of the ice. Despite the structural reorganisation, isotopic signatures remain clearly identifiable, particularly for modes associated with C−D and O−D vibrations. Crystallisation also resolves the previously blended O−H bending and CH3 deformation region, thereby facilitating the interpretation and tentative assignment of the corresponding bands observed at 10 K. In the far-infrared, further band sharpening is observed, together with a systematic red-shift upon deuteration of the hydroxyl group. Annealing to 120 K therefore provides a laboratory analogue of the thermal processing experienced by icy grain mantles as protostellar systems evolve from the cold prestellar phase toward warmer inner regions. The availability of both low-temperature (10 K) and annealed (120 K) spectra provides complementary benchmarks for the interpretation of infrared observations of interstellar ices. The 120 K spectra presented here are primarily intended to support temperature-dependent studies and are not analysed further in the present work. Finally, we note that the 120 K spectra of CH3OD and CD3OD exhibit a weak residual feature in the O–H stretching region between 3200 and 3600 cm−1 (2.78–3.13 μm). As these isotopologues do not contain an O–H group, this feature is attributed to trace contamination, most likely arising from small amounts of undeuterated methanol or water introduced during sample preparation. While this artefact does not affect the qualitative conclusions of this work, it should be considered in any quantitative analysis of these spectra.
 |
Fig. B.1 Transmission spectra of solid methanol and its five isotopologues at 120 K. The samples are identical to those shown in Fig. 2. The region between 650 to 590 cm−1 (15.4 to 16.9 μm), affected by increased noise from the beamsplitter, has been removed. The main CH3OH vibrational modes are indicated at the top. Spectra are vertically offset for clarity. |
Appendix C Concentration-dependent spectra of methanol mixtures
Fig. C.1 presents mid-infrared transmission spectra between 1600 to 800 cm−1 (6.25 to 12.5 μm) illustrating the behaviour of partially deuterated methanol isotopologues at increasing concentrations in binary and ternary laboratory ice analogues. For each isotopologue X ∈ {CH3OD, CH2DOH, CHD2OH, CD3OH, CD3OD}, we prepared a binary CH3OH : X mixture (left panel) with 9 %, 50 % and 66 % of X, as well as two ternary mixtures, H2O : CH3OH : X (centre panel) and CO : CH3OH : X (right panel), with 5 %, 25 % and 33 % of X. Percentages refer to the fraction of deuterated methanol relative to the total ice composition. All films were deposited in situ onto a silicon substrate held at 10 K under P ≈ 10−7 mbar and recorded using a Bruker Vertex 70v FTIR spectrometer at a spectral resolution of 1 cm−1. Successive spectra within each panel are vertically offset for clarity. With increasing deuterated methanol concentration, C–D and O–D absorption features systematically increase in intensity, accompanied by a corresponding reduction of neighbouring C–H and O–H bands. A particularly distinctive behaviour is observed for CH2DOH and CHD2OH, both of which exhibit double-peak structures in the 1350 to 1250 cm−1 range. For CH2DOH, this doublet appears near 1293 and 1326 cm−1 (7.73 and 7.54 μm), while for CHD2OH it is found near 1301 and 1329 cm−1 (7.69 and 7.52 μm). The six spectra in which these features are explicitly labelled A–F in Fig. C.1 correspond to all three ice matrices for both isotopologues. Fig. C.2 shows the integrated band areas of these double-peak regions as a function of the total isotopologue concentration. In all matrices, the resulting trends are approximately linear, indicating that these band pairs provide a quantitative tracer of CH2DOH and CHD2OH even in mixed ices. Together, this concentration-dependent spectral set provides a laboratory reference for the identification of partially deuterated methanol in water- and CO-rich interstellar ice analogues.
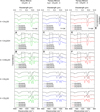 |
Fig. C.1 Collection of mid-infrared transmission spectra in the 1600 to 800 cm−1 (6.25 to 12.5 μm) region of binary CH3OH : X ices (left panel) and ternary H2O : CH3OH : X (centre panel) and CO : CH3OH : X (right panel) ices, where X ∈ {CH3OD, CH2DOH, CHD2OH, CD3OH, CD3OD}. Each panel presents spectra acquired at three increasing concentrations of X (9 %, 50 %, and 66 % for binary mixtures; 5 %, 25 %, and 33 % for ternary mixtures). Highlighted spectral regions (A–F) indicate the characteristic double-peak features of CH2DOH and CHD2OH in different ice environments, analysed further in Fig. C.2. All spectra were recorded at 10 K and are vertically offset for clarity. Additional experimental details are provided in Appendix C. |
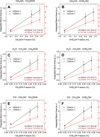 |
Fig. C.2 Integrated areas of the doublets marked in regions A–F of Fig. C.1. Panels A–F correspond to the same spectra shown in Fig. C.1. For each spectral window, the two peak components were integrated separately as a function of increasing deuterated methanol concentration, and the resulting band areas were plotted against the total fraction of CH2DOH and CHD2OH in the ice, showing an approximately linear dependence across all mixture types. |
Appendix D Mid- and near-infrared overtone and combination bands
Table D.1 compares selected near-infrared overtone and combination band positions measured in solid methanol isotopologues at 10 K with experimental and anharmonic VPT2 frequencies reported by Grabska et al. (2017) for dilute CCl4 solutions. The mean absolute deviation between our measurements and the closest reported band positions is approximately 11 cm−1, with individual deviations ranging from 2 to 32 cm−1. For the majority of selected bands, the solid-state values tend to lie closer to calculated anharmonic frequencies than to solution-phase experimental values. Table D.2 summarises the mid-infrared overtone and combination bands observed in solid methanol and its isotopologues at 10 K. The listed assignments are guided by the anharmonic vibrational calculations presented in this work and indicate the dominant contributing transition for each observed feature. Owing to strong anharmonicity, lattice effects, and extensive mode mixing in this spectral region, several bands are expected to contain additional weaker contributions beyond the dominant transition identified here.
Near-infrared combination bands of solid methanol and selected isotopologues at 10 K, compared with experimental values measured in dilute CCl4 solution and anharmonic calculated frequencies from Grabska et al. (2017).
Overtone and combination bands of solid methanol and its isotopologues at 10 K, comparing experimentally observed band positions with anharmonic calculated values presented in this work.
Appendix E Lattice modes of deuterated methanol ices at 120 K
The low-frequency infrared spectra recorded after annealing to 120 K are dominated by two classes of motions: (i) the internal methyl torsion (ν12) and (ii) collective lattice modes of the crystalline ice. In crystalline CH3OH, the torsional mode splits into two components, labelled A and B in Fig. E.1, appearing at 771 cm−1 and 680 cm−1, respectively. Substitution of the hydroxyl hydrogen by deuterium, as in CH3OD and CD3OD, shifts both components to lower wavenumbers, to 572 cm−1 and 493 cm−1, consistent with the increased reduced mass associated with the O–D rotor. In contrast, isotopic substitution confined to the methyl group (CH2DOH, CHD2OH, and CD3OH) leaves the A component close to the CH3OH value (771 cm−1), with a modest blue–shift to 772 to 778 cm−1 across the methyl-deuterated isotopologues, while the B component remains at 680 cm−1. At lower frequencies (< 400 cm−1), three lattice bands are observed for all isotopologues. These consist of a higher-frequency feature near 350 cm−1 (L1) and two lower-frequency bands near 290 cm−1 (L2) and 240 cm−1 (L3). Isotopic substitution leads only to modest red–shifts, typically not exceeding 10 cm−1, reflecting the collective nature of these vibrations. The positions of the torsional and lattice features are indicated in Fig. E.1, with corresponding frequencies summarised in Table E.1.
Frequencies of the two torsional components (A, B) and the three strongest lattice modes (L1–L3) of crystalline methanol and its isotopologues at 120 K.
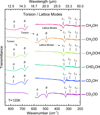 |
Fig. E.1 Transmission spectra of crystalline methanol ice (CH3OH) and its isotopologues at 120 K in the far-infrared. The two torsional components as well as the three strongest lattice modes are marked. The spectral region between 650 to 590 cm−1 is not shown due to noise introduced by the beamsplitter. Spectra are vertically offset for clarity. |
All Tables
Fundamental C−H and C−D stretches of solid methanol and its isotopologues at 10 K.
Deuterated vibrational modes of CH3OD in astrophysical ice mixtures at 10 K in the mid-infrared region.
Deuterated vibrational modes of CH2DOH in astrophysical ice mixtures at 10 K in the mid-infrared region.
Deuterated vibrational modes of CHD2OH in astrophysical ice mixtures at 10 K in the mid-infrared region.
Deuterated vibrational modes of CD3OH in astrophysical ice mixtures at 10 K in the mid-infrared region.
Deuterated vibrational modes of CD3OD in astrophysical ice mixtures at 10 K in the mid-infrared region.
Mid-infrared vibrational modes of amorphous methanol ice (CH3OH) and its isotopologues between 2300 and 800 cm–1 at 10 K.
Near-infrared combination bands of solid methanol and selected isotopologues at 10 K, compared with experimental values measured in dilute CCl4 solution and anharmonic calculated frequencies from Grabska et al. (2017).
Overtone and combination bands of solid methanol and its isotopologues at 10 K, comparing experimentally observed band positions with anharmonic calculated values presented in this work.
Frequencies of the two torsional components (A, B) and the three strongest lattice modes (L1–L3) of crystalline methanol and its isotopologues at 120 K.
All Figures
|
Fig. 1 Schematic representation of the cryostat’s vacuum chamber, coupled to the Bruker Vertex 70v spectrometer at CAS. Adapted from Giuliano et al. (2019). |
| In the text | |
|
Fig. 2 Transmission spectra of solid methanol and its five isotopologues at 10 K. The region between 650 to 590 cm−1 (15.4 to 16.9 μm), affected by increased noise from the beamsplitter, has been removed. The main CH3OH vibrational modes are indicated at the top. Spectra are vertically offset for clarity. |
| In the text | |
|
Fig. 3 Transmission spectra of solid methanol and its isotopologues recorded at 10 K, highlighting the O–H/O–D stretching region. For CH3OH, the dashed rectangle marks the O–H stretching band. The labels ν(O–H) and ν(O–D) denote the fundamental O–H and O–D stretching modes, respectively. Corresponding peak positions are listed in Table 3. Spectra are vertically offset for clarity. |
| In the text | |
|
Fig. 4 Transmission spectra of solid methanol and its isotopologues recorded at 10 K, focusing on the C−H/C−D stretching region. For CH3OH, the dashed rectangle marks the C−H stretching bands. The stretching fundamentals are labelled vas and vs, with the vibrating group indicated in parentheses. The corresponding peak positions are listed in Table 4 Spectra are vertically offset for clarity. |
| In the text | |
|
Fig. 5 Transmission spectra of solid methanol and its isotopologues recorded at 10 K, highlighting the CH3 deformation region. Modes are labelled δ for the in-plane bend. δas and δs denote the asymmetric and symmetric components, respectively, with the vibrating group given in parentheses. For CH3OH, the dashed rectangle marks the CH3 deformation region. Corresponding peak positions are listed in Table 5. Spectra are vertically offset for clarity. |
| In the text | |
|
Fig. 6 Transmission spectra of solid methanol and its isotopologues recorded at 10 K, showing the O–H/O–D bending region. The bending fundamentals are labelled δ(OH) and δ(OD). For CH3OH, the dashed rectangle marks the O–H bending band. Corresponding peak positions are listed in Table 6. Spectra are vertically offset for clarity. |
| In the text | |
|
Fig. 7 Transmission spectra of solid methanol and its isotopologues recorded at 10 K, highlighting the methyl rocking region. Rocking (ρ), twisting (τ), and wagging (ω) modes are indicated, with the vibrating group given in parentheses. For CH3OH, the dashed rectangle marks the CH3 rocking bands. Corresponding peak positions are listed in Table 7. Spectra are vertically offset for clarity. |
| In the text | |
|
Fig. 8 Transmission spectra of solid methanol and its isotopologues recorded at 10 K, highlighting the C–O stretching region. The fundamental is labelled ν(C–O). For CH3OH, the dashed rectangle marks the C–O stretching band. Corresponding peak positions are listed in Table 8. Spectra are vertically offset for clarity. |
| In the text | |
|
Fig. 9 Transmission spectra of solid methanol and its isotopologues recorded at 10 K, highlighting the methyl-torsion region. The torsional fundamental is labelled Φ(C−O). For CH3OH, the dashed rectangle marks the torsional band. Corresponding peak positions are listed in Table 9. Spectra are vertically offset for clarity. |
| In the text | |
|
Fig. 10 Transmission spectra of solid methanol and its isotopologues recorded at 10 K, showing combination and overtone bands. Spectra are vertically offset for clarity. |
| In the text | |
|
Fig. 11 Transmission spectra of pure methanol ice and deuterated methanol (CH3OD) embedded in three astrophysical ice matrices at 10 K. Key vibrational features associated with deuteration are marked by vertical dashed lines; their centres vary within 1 cm−1 across the matrices (see Table 10). Spectra are vertically offset for clarity. |
| In the text | |
|
Fig. 12 Transmission spectra of pure methanol ice and deuterated methanol (CH2DOH) embedded in three astrophysical ice matrices at 10 K. Key vibrational features associated with deuteration are marked by vertical dashed lines; their centres vary by 1–4 cm−1 across the matrices (see Table 11). Spectra are vertically offset for clarity. |
| In the text | |
|
Fig. 13 Transmission spectra of pure methanol ice and deuterated methanol (CHD2OH) embedded in three astrophysical ice matrices at 10 K. Key vibrational features associated with deuteration are marked by vertical dashed lines; their centres vary within 1–2 cm−1 across the matrices (see Table 12). Spectra are vertically offset for clarity. |
| In the text | |
|
Fig. 14 Transmission spectra of pure methanol ice and deuterated methanol (CD3OH) embedded in three astrophysical ice matrices at 10 K. Key vibrational features associated with deuteration are marked by vertical dashed lines; their centres vary within 1–3 cm−1 across the matrices (see Table 13). Spectra are vertically offset for clarity. |
| In the text | |
|
Fig. 15 Transmission spectra of pure methanol ice and deuterated methanol (CD3OD) embedded in three astrophysical ice matrices at 10 K. Key vibrational features associated with deuteration are marked by vertical dashed lines; their centres vary within 1–2 cm−1 across the matrices (see Table 14). Spectra are vertically offset for clarity. |
| In the text | |
|
Fig. B.1 Transmission spectra of solid methanol and its five isotopologues at 120 K. The samples are identical to those shown in Fig. 2. The region between 650 to 590 cm−1 (15.4 to 16.9 μm), affected by increased noise from the beamsplitter, has been removed. The main CH3OH vibrational modes are indicated at the top. Spectra are vertically offset for clarity. |
| In the text | |
|
Fig. C.1 Collection of mid-infrared transmission spectra in the 1600 to 800 cm−1 (6.25 to 12.5 μm) region of binary CH3OH : X ices (left panel) and ternary H2O : CH3OH : X (centre panel) and CO : CH3OH : X (right panel) ices, where X ∈ {CH3OD, CH2DOH, CHD2OH, CD3OH, CD3OD}. Each panel presents spectra acquired at three increasing concentrations of X (9 %, 50 %, and 66 % for binary mixtures; 5 %, 25 %, and 33 % for ternary mixtures). Highlighted spectral regions (A–F) indicate the characteristic double-peak features of CH2DOH and CHD2OH in different ice environments, analysed further in Fig. C.2. All spectra were recorded at 10 K and are vertically offset for clarity. Additional experimental details are provided in Appendix C. |
| In the text | |
|
Fig. C.2 Integrated areas of the doublets marked in regions A–F of Fig. C.1. Panels A–F correspond to the same spectra shown in Fig. C.1. For each spectral window, the two peak components were integrated separately as a function of increasing deuterated methanol concentration, and the resulting band areas were plotted against the total fraction of CH2DOH and CHD2OH in the ice, showing an approximately linear dependence across all mixture types. |
| In the text | |
|
Fig. E.1 Transmission spectra of crystalline methanol ice (CH3OH) and its isotopologues at 120 K in the far-infrared. The two torsional components as well as the three strongest lattice modes are marked. The spectral region between 650 to 590 cm−1 is not shown due to noise introduced by the beamsplitter. Spectra are vertically offset for clarity. |
| In the text | |
Current usage metrics show cumulative count of Article Views (full-text article views including HTML views, PDF and ePub downloads, according to the available data) and Abstracts Views on Vision4Press platform.
Data correspond to usage on the plateform after 2015. The current usage metrics is available 48-96 hours after online publication and is updated daily on week days.
Initial download of the metrics may take a while.