Fig. 5
Download original image
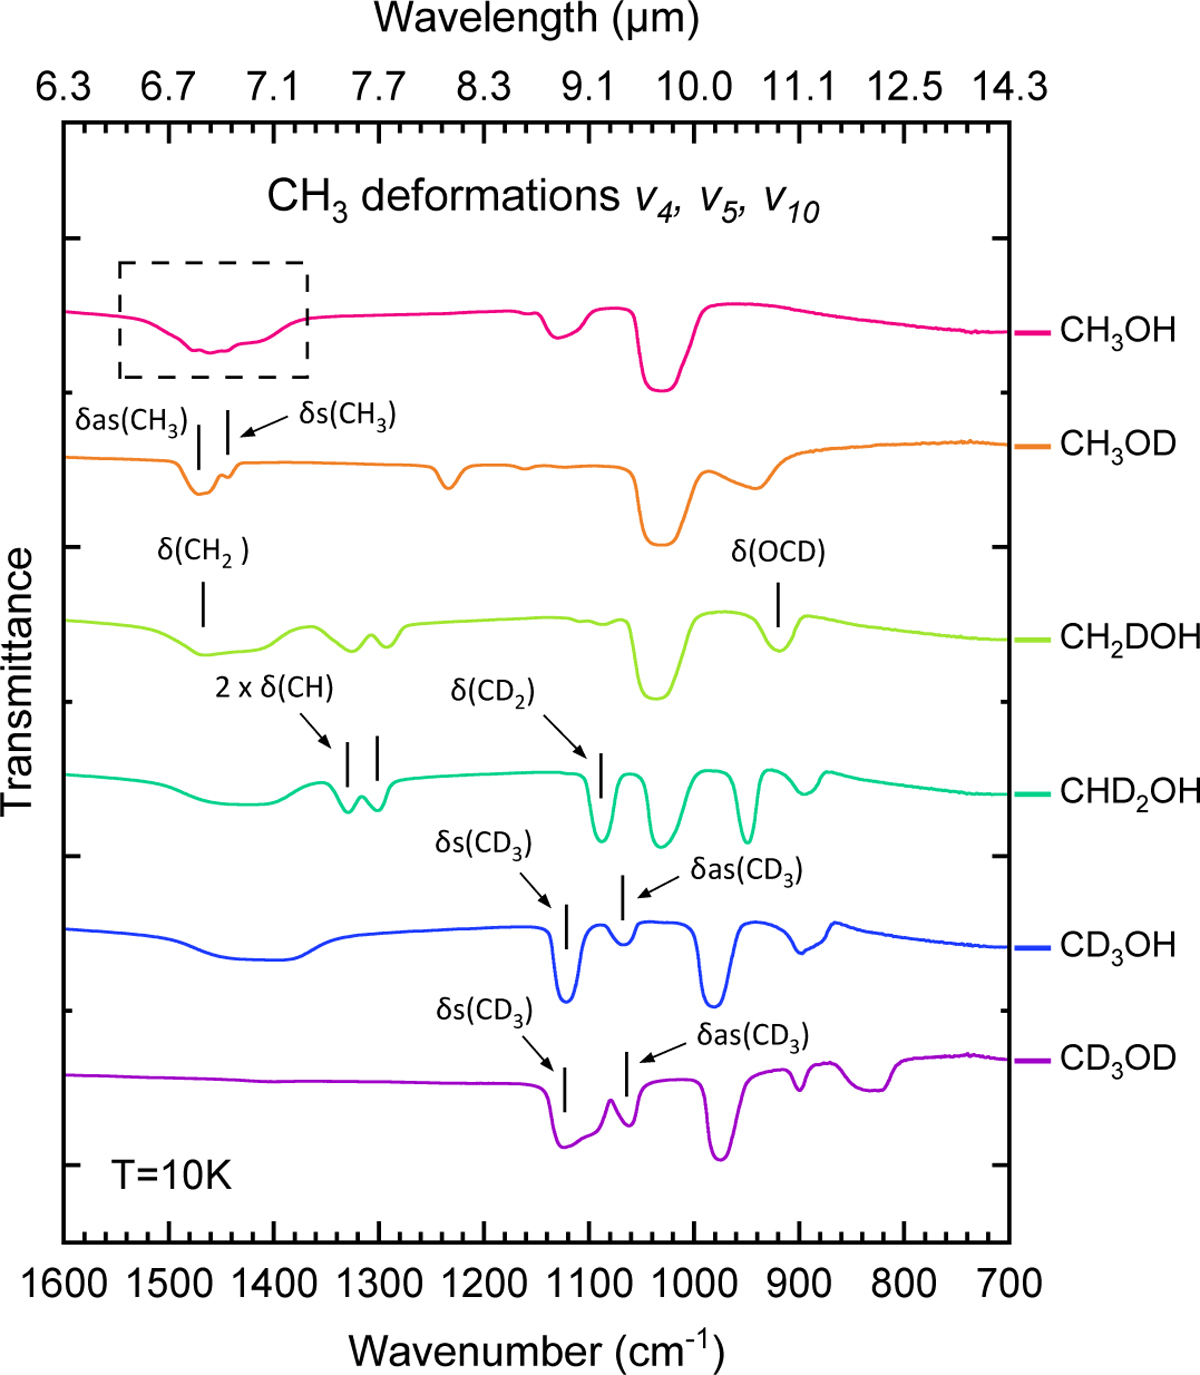
Transmission spectra of solid methanol and its isotopologues recorded at 10 K, highlighting the CH3 deformation region. Modes are labelled δ for the in-plane bend. δas and δs denote the asymmetric and symmetric components, respectively, with the vibrating group given in parentheses. For CH3OH, the dashed rectangle marks the CH3 deformation region. Corresponding peak positions are listed in Table 5. Spectra are vertically offset for clarity.
Current usage metrics show cumulative count of Article Views (full-text article views including HTML views, PDF and ePub downloads, according to the available data) and Abstracts Views on Vision4Press platform.
Data correspond to usage on the plateform after 2015. The current usage metrics is available 48-96 hours after online publication and is updated daily on week days.
Initial download of the metrics may take a while.