Fig. 1
Download original image
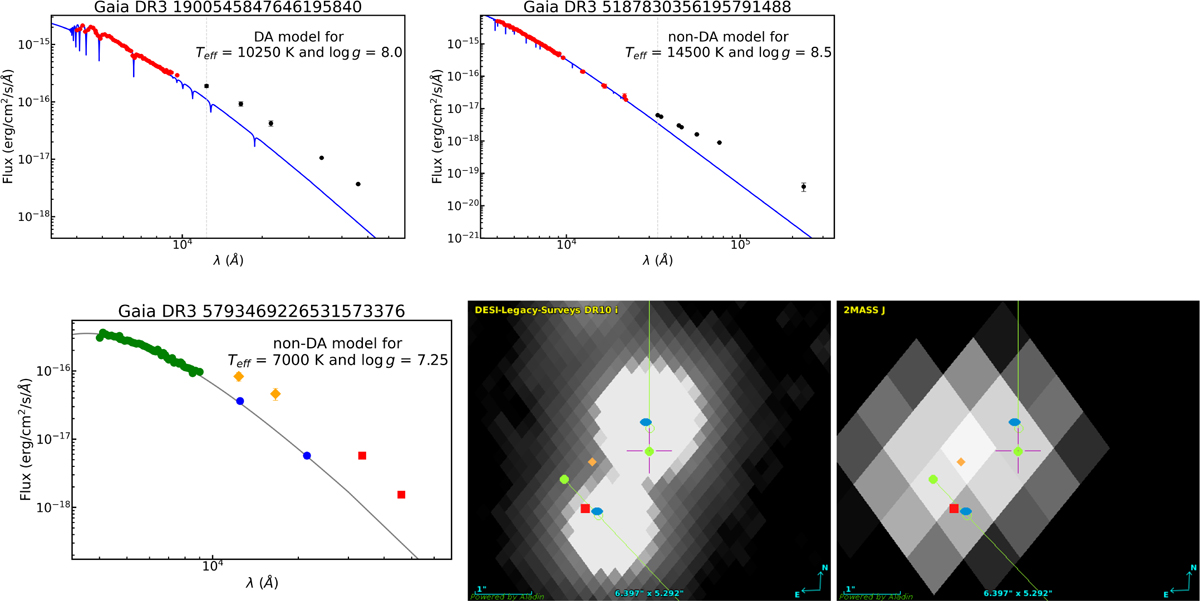
SEDs of two white dwarfs (Gaia DR3 1900545847646195840 and Gaia DR3 5187830356195791488) showing IR excess emission. The left-hand panel shows an example of a DA model fit, and the right-hand panel an example of a non-DA model fit. Models are shown with blue lines and the photometric data with black or red points depending on whether excess flux emission with respect to the model is detected or not, respectively.
Current usage metrics show cumulative count of Article Views (full-text article views including HTML views, PDF and ePub downloads, according to the available data) and Abstracts Views on Vision4Press platform.
Data correspond to usage on the plateform after 2015. The current usage metrics is available 48-96 hours after online publication and is updated daily on week days.
Initial download of the metrics may take a while.