| Issue |
A&A
Volume 707, March 2026
|
|
|---|---|---|
| Article Number | A268 | |
| Number of page(s) | 12 | |
| Section | Catalogs and data | |
| DOI | https://doi.org/10.1051/0004-6361/202557709 | |
| Published online | 17 March 2026 | |
Gaia white dwarfs with infrared excess
I. The 100 pc catalogue
1
Centro de Astrobiología (CAB), CSIC-INTA,
Camino Bajo del Castillo s/n,
28692,
Villanueva de la Cañada,
Madrid,
Spain
2
Departament de Física, Universitat Politècnica de Catalunya,
c/Esteve Terrades 5,
08860
Castelldefels,
Spain
3
Institut d’Estudis Espacials de Catalunya,
c/Esteve Terradas 1, Edifici RDIT, Campus PMT-UPC,
08860
Castelldefels,
Spain
★ Corresponding author: This email address is being protected from spambots. You need JavaScript enabled to view it.
Received:
15
October
2025
Accepted:
3
February
2026
Abstract
Context. The presence of infrared (IR) excess flux observed in white dwarfs is related to the existence of debris disks or substellar companions. These systems provide important clues in studies of extrasolar planetary material and binary evolution. However, fully characterising their properties requires a statistically significant, complete sample.
Aims. This work aims to identify a complete sample of white dwarfs with IR excess emission within 100 pc of the Sun.
Methods. We built the spectral energy distributions (SEDs) of the white dwarfs using synthetic photometry in 56 optical filters of the Javalambre Physics of the Accelerating Universe Astronomical Survey system, generated from Gaia Data Release 3 low-resolution spectra and complemented with the latest IR photometry available at the Virtual Observatory. We used
Virtual Observatory SED Analyzer (VOSA)to fit the SEDs with different atmospheric white dwarf models depending on the source spectral type. We visually checked the optical and IR images to identify any contaminated photometry.
Results. We built a catalogue of 456 IR excess white dwarfs, of which 292 were robust identifications, and 164 were candidates; of the total, 351 (∼75%) were new identifications. This implies a fraction of IR excess white dwarfs between 5.9 ± 0.3% and 9.2±0.4%, which is higher than previous works, but in agreement with some more recent estimates. Furthermore, for the sample of IR excess white dwarfs, the fraction of sources with non-hydrogen atmosphere increases with the Gaia GBP − GRP colour, in contrast to the general white dwarf population. However, this result should be interpreted with caution. Additionally, a thorough comparison of our catalogue with those of previous studies was performed.
Conclusions. The sample of white dwarfs with IR excess emission within 100 pc presented in this work is the largest, most complete, and most reliable to date. Thanks to their proximity, they are ideal targets for follow-up studies aimed at characterising circumstellar disks and substellar companions, as well as the composition of accreted planetary material.
Key words: catalogs / virtual observatory tools / circumstellar matter / stars: evolution / white dwarfs
© The Authors 2026
 Open Access article, published by EDP Sciences, under the terms of the Creative Commons Attribution License (https://creativecommons.org/licenses/by/4.0), which permits unrestricted use, distribution, and reproduction in any medium, provided the original work is properly cited.
This article is published in open access under the Subscribe to Open model. This email address is being protected from spambots. You need JavaScript enabled to view it. to support open access publication.
1 Introduction
The vast majority of stars have already become (or will end up becoming) white dwarfs (e.g. Althaus et al. 2010), making these objects very common in our Galaxy and important carriers of information about their progenitors. They address key problems in astrophysics, serving as estimators of galactic evolution and star formation history (Rebassa-Mansergas et al. 2015; Torres et al. 2021; Lam & Rowell 2025), reliable cosmic chronometers (Fontaine et al. 2001; Rebassa-Mansergas et al. 2023), and natural laboratories for testing fundamental physics under extreme conditions (Isern et al. 2022). Moreover, white dwarfs have been identified as key objects for probing the elemental composition of extrasolar planetary material through the study of metal abundances in their atmospheres (Jura 2003).
Due to their high density, heavier elements than hydrogen diffuse to the deep interiors of white dwarfs. As a consequence, a large percentage of them (∼70%; Torres et al. 2023; Jiménez-Esteban et al. 2023; Manser et al. 2024) show hydrogen lines in their spectra. However, helium or carbon can arise to the surface during the evolution (i.e. cooling) of white dwarfs, especially when they cool enough to become convective (Koester & Kepler 2019; Rolland et al. 2020; Bédard 2024). Moreover, 25–50% of them show metal-pollution in their atmospheres as revealed by optical and/or ultraviolet spectroscopy (Zuckerman et al. 2003, 2010; Koester et al. 2014), which is thought to arise from accretion of planetary material (Jura 2003; Jura & Young 2014). In this scenario, a surviving planet (although a brown dwarf cannot be ruled out; see, e.g., Casewell et al. 2024) perturbs the orbit of a minor body (asteroid-, comet-, or moon-like in composition). The minor body enters the white dwarf tidal radius, becomes tidally disrupted, with its fragments eventually becoming accreted onto the white dwarf (Debes & Sigurdsson 2002; Mustill et al. 2024; Veras et al. 2024).
The disruption of a minor body is expected to form a circumstellar dust or gas disk around the white dwarf (Debes et al. 2012b; Veras et al. 2014; Malamud & Perets 2020b,a), from which material is accreted onto its surface (Veras et al. 2015; Malamud et al. 2021; Li et al. 2021; Brouwers et al. 2022). There is overwhelming observational evidence for the existence of both dust and gas disks around white dwarfs, supporting the above scenario. Dust disks have been detected at infrared (IR) wavelengths for about 1–4% of all white dwarfs1 (e.g. Rocchetto et al. 2015; Farihi 2016; Rebassa-Mansergas et al. 2019; Wilson et al. 2019; Rogers et al. 2020; Wang et al. 2023). Gas disks are considerably less common, but typical double-peaked spectral features have been observed in the optical for a few dozen white dwarfs (e.g. Gänsicke et al. 2006; Farihi et al. 2012; Brinkworth et al. 2012; Debes et al. 2012a; Melis et al. 2020; Owens et al. 2023). Moreover, the existence of circumstellar material is corroborated by the observation of transits caused by disintegrating bodies (e.g. Vanderburg et al. 2015; Manser et al. 2019; Guidry et al. 2021; Farihi et al. 2022; Aungwerojwit et al. 2024). Additional evidence for the ongoing accretion process in metal-polluted white dwarfs arises from the detection of X-rays (Cunningham et al. 2022). Once accretion ensues on the white dwarf, the diffusion times are expected to range from ∼yr in hydrogen-rich atmospheres to ∼Myr in helium-rich ones (Harrison et al. 2021). The diffusion timescales of helium-rich atmospheres are presumably longer than the typical lifetime of dusty disks (Girven et al. 2012; Cunningham et al. 2021). This could explain why the percentage of white dwarfs that display IR excess due to the existence of an accretion disk is considerably smaller than the fraction showing metal-pollution in their atmospheres. Another possibility is that these disks are too faint to be detected.
White dwarfs with IR excess are excellent candidates for spectroscopic follow-up studies aimed at revealing the chemical composition of the accreted bodies and hence of extra-solar planetary material (e.g. Farihi et al. 2013; Raddi et al. 2015; Xu et al. 2017; Hollands et al. 2018; Swan et al. 2019; Badenas-Agusti et al. 2024). However, most of the existing IR excess white dwarf samples are magnitude-limited, which is an obstacle to the derivation of realistic determinations of the incidence of metal-polluted white dwarfs as a function of effective temperature and mass. In this paper, we aimed to solve this issue via making use of the Gaia Data Release 3 (DR3; Gaia Collaboration 2023b) to search for new IR excess white dwarfs among all objects located within 100 pc from the Sun.
The 100 pc white dwarf sample is expected to be a nearly complete volume-limited sample (Jiménez-Esteban et al. 2018). The work presented here superseded the one we performed in Rebassa-Mansergas et al. (2019, hereafter RM+19), which made use of the former second Data Release of Gaia. At present, Gaia DR3 provides low-resolution spectra, which allow for more robust optical spectral energy distributions (SEDs) to be built, as compared to those obtained in RM+19. Moreover, a larger number of white dwarfs now have available IR photometry from different surveys, which considerably increased the initial sample intended for study. In addition, with the aim of presenting a sample of IR excess white dwarfs as pure as possible, we performed a thorough search for contaminants. Finally, we carried out an exhaustive comparison between our catalogue and those in the literature. In a second publication, we will perform a stellar parameter determination and analysis of the full catalogue, including also a discussion on the origin of the detected excess (arising either from a circumstellar disk or from a low-mass or brown dwarf companion).
The paper is organised as follows. In Section 2 we introduce our methodology for identifying IR excess white dwarfs. In Section 3, we describe our results. In Section 4, we compare our catalogue with previously published samples. In Section 5, we discuss the IR excess fraction obtained, and we present our conclusions in Section 6.
2 Identification of sources with IR excess emission
We identified the IR excess from the analysis of the SEDs, as in RM+19.
2.1 The 100 pc sample
The initial sample of this work contained 8150 white dwarfs spectroscopically classified and characterised by Jiménez-Esteban et al. (2023, hereafter JE+23). In that work, the authors built a volume-limited catalogue of 12 718 white dwarfs within 100 pc from the Sun. The white dwarf candidates of Gaia DR3 were selected from their position in the Gaia Hertzsprung-Russell diagram (HRD) after imposing the following astrometric and photometric quality criteria:
- (i)
ω − 3σω ≥ 10 mas and ω/σω ≥ 10; where ω is the parallax and σω is its error;
- (ii)
 and
and  ; where FBP and FRP are the integrated BP and RP mean fluxes, and
  and
and  are their respective errors;
 - (iii)
RUWE < 1.4, which is the renormalised unit weight error; values of RUWE > 1.4 indicate a poor astrometric solution (Lindegren et al. 2021);
- (iv)
 ; where C∗ is the corrected BP and RP flux excess factor and
  its scatter following the prescription by Riello et al. (2021).
Additionally, the authors fitted the SEDs of 8150 white dwarfs with GBP − GRP < 0.86 (Teff ≳ 5500 K) with models to classify them as either pure hydrogen atmosphere (DA) white dwarfs or non-DA white dwarfs, the latter lacking hydrogen and represented in that work by helium atmospheres. We refer to JE+23 for a detailed explanation of the classification methodology. These 8150 spectroscopically classified objects were our initial search sample for IR excess emission.
2.2 Spectral energy distributions
We built the SEDs from the optical to the mid-infrared (MIR) wavelength range. For the optical range, we used GaiaXPy2 to obtain synthetic photometry from the Gaia DR3 spectra using all their coefficients (Carrasco et al. 2021). For the IR range (λ ≥ 12 000 Å), we compiled photometric data from public surveys in the Virtual Observatory (VO3) with the aid of
Topcat(Taylor 2005).
2.2.1 Optical photometry
We used the same methodology as in JE+23 to obtain the optical photometry from the Gaia DR3 spectra. Thus, we selected the photometric system of Javalambre Physics of the Accelerating Universe Astronomical Survey (J-PAS4; Benitez et al. 2014; Marín-Franch et al. 2012) for the synthetic photometry obtained from the Gaia spectra. This selection was made for the following two reasons: i) it samples nearly the whole wavelength range covered by Gaia (≈3300–10 500 Å) with a total of 60 filters: 54 narrow filters (≈3780–9100 Å, with a full width at half-maximum ≈145 Å), 2 wider filters in the reddest and bluest part of the wavelength range, and 4 Sloan Digital Sky Survey (SDSS) -like filters; ii) the spectral resolution of the photo-spectra obtained is similar to Gaia DR3 low-resolution spectra (R ≈ 60). Due to the low signal-to-noise ratio (S/N) at the bluest end of the Gaia DR3 spectra (Gaia Collaboration 2023a), we only kept J-PAS filters with effective λ ≥ 4000 Å, reducing the number of J-PAS filters to 56. We also imposed a quality cut in photometry, keeping only data with flux relative errors lower than 10% and only selecting objects with at least four J-PAS photometry points. All 8150 initial objects satisfied these criteria.
IR data from VO archives used to build the SEDs.
2.2.2 IR photometry
To extend the coverage of the SED to longer wavelengths (λ > 12 000 Å), we searched for the available photometry at the following surveys: Two Micron All Sky Survey (2MASS; Skrutskie et al. 2006), UKIRT Infrared Deep Sky Survey (UKIDSS; Hewett et al. 2006), Visible and Infrared Survey Telescope for Astronomy (VISTA; Cross et al. 2012), Wide-field Infrared Survey Explorer (WISE; Wright et al. 2010), Spitzer (Werner et al. 2004), Midcourse Space Experiment (MSX; Egan & Price 1996), AKARI (Murakami et al. 2007), and Infrared Astronomical Satellite (IRAS; Olnon et al. 1986). We note that the Y and Z VISTA and UKIDSS photometry were excluded because this region of the SED was already covered by the synthetic J-PAS photometry.
In order to avoid misidentifications of high proper motion white dwarfs, we translated the Gaia coordinates to an epoch closer to the mean observation epoch of each survey using the proper motion provided by Gaia DR3. We used epoch J2000 for 2MASS, MSX, and IRAS, as well as J2005 and J2010 for AKARI and Spitzer, respectively, J2015.4 for WISE, and finally, J2016 for UKIDSS and VISTA. We then limited the search into a 3″ radius. The search for counterparts in AKARI, IRAS, and MSX returned no results for our white dwarf sample.
Afterwards, we cleaned up the photometry found by selecting those data with good quality flags. Table 1 shows filters and quality flags used for each survey. It also includes a note listing the used catalogues.
To have reliable IR excess detection, we only kept SEDs with at least three photometric points at wavelengths longer than 12 000 Å. This resulted in a sample of 5084 objects for the IR excess emission search.
Thus, the analysed SEDs contained at least seven photometric points (four in the optical and three in the IR) up to a maximum of 71, with ∼70% of them containing 59 or more photometric points.
2.3 Excess emission identification
We used the
Virtual Observatory SED Analyzer(
VOSAv6; Bayo et al. 2008) to identify possible IR excess emission by single object model SED fitting.
The
VOSAtool performed two automatic analyses of the photometric data to detect any possible flux excess emission. The first analysis consisted of calculating the regression slope (α; Lada et al. 2006) of the observational data in the log νFν versus log ν flux-frequency plane, starting at the first point with λ > 21 500 Å, and adding one new data point at a time in increasing wavelength direction. When the regression slope, α, taking into account its error, was smaller than 2.56, then
VOSAflagged the data point as affected by IR excess. The flagged data points were not longer considered in the subsequent model fitting.
After this first analysis, we fit the SEDs with white dwarf atmospheric models of Koester (2010). We used DA and non-DA models depending on the spectral classification by JE+23 (see Sect. 2.1). This spectral classification delivered an accuracy of over 90% when using the Montreal White Dwarf Database (MWDD) classification as reference and is in fair agreement with a later classification based on more sophisticated artificial intelligence algorithms (García-Zamora et al. 2025). We refer to JE+23 for a more detailed description of the grid of models. Then,
VOSAperformed the second automatic analysis, consisting of a comparison of the observational photometry with the synthetic photometry obtained from the model that best fits the data; that is, the fit with the lowest value of the reduced chi-squared parameter (χ2). Thus, if i) the observed flux was significantly larger (>20%) than the predicted one and ii) the observed flux was above the predicted one by more than three times the observational error (
 ), then the photometric point was marked as affected by excess emission. Additionally, based on a visual inspection of all the fits, we manually modified for a few cases the first filter affected by IR excess at λ < 21 500 Å.
Figure 1 shows an example of a good fit to a DA model (left-hand panel) and to a non-DA model (right-hand panel) with IR excess emission.
Following this process, we selected only those SEDs with at least two photometric points showing excess emission, making a total of 674 sources.
2.4 Cleaning up of photometric contamination
The final step in building the sample was a visual inspection of astronomical images to identify mismatched counterparts or contaminated photometry in the IR catalogues for the 674 sources identified in the previous step. For this task, we used
Aladin7 (Bonnarel et al. 2000), one of the most widely used VO tools. It is an interactive sky atlas that enables the visualisation of astronomical images and the overlaying of catalogue data.
Thus, we visualized images of different surveys in the optical with Dark Energy Spectroscopic Instrument (DESI) Legacy Imaging Survey (Dey et al. 2019), PanSTARRS (Chambers et al. 2016), Sloan Digital Sky Survey Data Release 9 (SDSS9; Ahn et al. 2012), and Digitized Sky Survey Data Release 2 (DSS2; Lasker et al. 1996), as well as in the IR with 2MASS, UKIDSS, VISTA, WISE and Spitzer. Additionally, for each white dwarf, we overplotted the Gaia DR3 counterpart together with the counterparts at the different IR catalogues used to build the object SED. For illustrative purposes, in Figure 2, we show the DESI optical i-band and 2MASS IR J-band images of
Gaia DR3 5793469226531573376, which had a contaminated SED. The optical image clearly shows a field source near the white dwarf, which is not resolved in the 2MASS image. Thus, in contrast to Gaia and VISTA, the photometric measurements of 2MASS and WISE, which have worse resolution power than 2MASS, are the combined emission of both objects. After discarding the 2MASS and WISE data, the SED did not show any excess emission.
During the visual inspection of the available images at Aladin, which was essential in the identification of photometric contamination due to nearby objects, we labelled the SEDs in three categories: contaminated photometry, reliable excess emission, and tentative excess emission. In the case of identification of contaminated photometry, we dropped the corresponding photometry data from the SEDs and reanalysed them with
VOSAto check if the SEDs continued showing excess emission or not. After this process, we rejected 218 sources whose corrected SEDs no longer showed excess emission (65) or had insufficient (<3) IR photometry points (153).
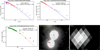 |
Fig. 1 SEDs of two white dwarfs (Gaia DR3 1900545847646195840 and Gaia DR3 5187830356195791488) showing IR excess emission. The left-hand panel shows an example of a DA model fit, and the right-hand panel an example of a non-DA model fit. Models are shown with blue lines and the photometric data with black or red points depending on whether excess flux emission with respect to the model is detected or not, respectively. |
 |
Fig. 2 Example of a white dwarf SED with contaminated photometry, Gaia DR3 5793469226531573376. Left panel: SED with the photometric data shown with different colours and symbols: J-PAS with green points, 2MASS with orange diamonds, VISTA with blue ovals, and WISE with red squares. The grey line corresponds to the non-DA model that best fits the photometric data. Middle and right panels: DESI (optical) and 2MASS (NIR) images, respectively, centred at the Gaia DR3 position of the white dwarf at epoch J2000 (magenta cross) and showing the white dwarf and a nearby field star at the southeast. Gaia DR3 counterparts at epochs J2000 and J2015.4 are shown with green solid and empty circles, respectively. Gaia DR3 proper motion directions are shown with green lines. The line running from south to north is for the white dwarf, while the line running from northeast to southwest is for the nearby field star. The 2MASS counterpart is shown as an orange diamond, the WISE counterpart is shown as a red square, and the VISTA counterparts are shown as blue ovals. |
3 The IR excess white dwarf sample
The whole process described in the previous section ended up with a sample of 456 white dwarfs displaying IR excess (hereafter, ‘the IR excess sample’). Among these, 292 show a reliable excess detection (hereafter, ‘the reliable sample’), including 157 DA and 135 non-DA white dwarfs. The remaining 164 white dwarfs present a tentative excess (hereafter, ‘the tentative sample’), with 117 classified as DAs and 47 as non-DAs. The whole IR excess sample is publicly accessible at the CDS VizieR catalogue service8 and at The SVO archive of White Dwarfs from Gaia9, an online archive hosted at the Spanish Virtual Observatory (SVO) website. Instructions on how to access the catalogue and a table with the list and the description of the parameters provided for each object are available in Appendix A.
Figure 3 shows the IR excess sample in the Gaia HRD. DAs are shown on the left panel and non-DAs on the right panel. No significant differences are visible between the distribution of the sources with reliable (dark colour) and tentative (light colour) IR excess identification, regardless of spectral type. The distribution of DAs and non-DAs with IR excess is also similar to the corresponding general distribution of DAs and non-DAs populations of white dwarfs within 100 pc (grey circles). Notably, the concentration of non-DAs shows IR excess at the reddest colours, which is not present for the DAs.
Figure 4 shows the ratio of non-DA white dwarfs with IR excess relative to the total number of white dwarfs with IR excess, NT = NDA + Nnon−DA, as a function of GBP − GRP colour for the reliable sample (left panel) and the full IR excess sample (right panel). Additionally, we show this ratio for the general population of white dwarfs at 100 pc. The errors were calculated assuming a binomial distribution as  , where f is the fraction of positive cases and N the total number of cases.
There was a clear trend of increasing ratio with increasing colour, less pronounced if we considered both the reliable and the tentative detections (right panel), but still very clear. This is consistent with the overdensity of non-DAs at redder colours in Figure 3. Although this first analysis indicates an increasing ratio of IR excess among non-DAs compared to the general population, the result should be interpreted with caution, especially for the reddest bins. This may reflect observational or methodological biases affecting the faint end of the sample. Non-DA atmospheric models, particularly for cool helium-rich atmospheres, are subject to larger uncertainties in the IR regime (e.g Kowalski 2014; Blouin et al. 2017) and might therefore be more prone to apparent IR excess than DA models. This effect could reflect limitations in current atmospheric modelling rather than a genuine astrophysical trend. Thus, a more robust interpretation will require accurate determinations of stellar temperatures to be presented in a forthcoming publication.
Finally, Figure 5 shows the ratio of white dwarfs with IR excess (both tentative plus reliable and only reliable) with respect to the total number of white dwarfs with enough IR photometric data to be searched for IR excess in this work (after excluding the contaminated photometry, as a function of the GBP − GRP colour). While the ratio remained relatively constant, a noticeable increase was observed at the redder end of the distribution. This is in line with some studies that suggest that asteroid or planetesimal disruption might occur over long timescales, potentially affecting older white dwarfs (e.g. Veras & Heng 2020, and references therein), although this trend is not firmly established (e.g. Xu et al. 2020). Moreover, cooler white dwarfs emit less flux, making even a small IR excess easily detectable. However, this apparent increase in the redder bins of Fig. 5 may largely reflect the high number of non-DA white dwarfs with identified IR excess in those bins, which should be interpreted with caution. In Sect. 5, we provide a more detailed analysis of the fraction of white dwarfs exhibiting IR excess.
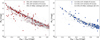 |
Fig. 3 Gaia HRDs for the DAs (left panel) and non-DAs (right panel) with reliable and tentative IR excess detections. For comparison, we show the 100 pc white dwarf DAs (left panel) and non-DAs (right panel) population from JE+23. |
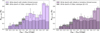 |
Fig. 4 Distribution of the fraction of non-DAs with IR excess relative to the total number of white dwarfs with IR excess as a function of the Gaia colour. The reliable sample is shown in the left panel, and the total IR excess sample in the right panel. For comparison, the same ratio for the general population of white dwarfs at 100 pc is shown in grey. |
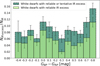 |
Fig. 5 Distribution of the fraction of white dwarfs with IR excess with respect to the number of white dwarfs with enough IR photometry data in function of the Gaia colour. |
4 Comparisons with previous works
In this section, we compared our catalogue with other works found in the literature. These works were divided into two groups: those using photometry to identify white dwarf candidates with IR excess and those for which the IR excess was spectroscopically confirmed.
4.1 Photometric IR excess catalogues
4.1.1 Candidates from UKIDSS DR8
Two works by Steele et al. (2011) and Girven et al. (2011) used UKIDSS DR8 near-infrared (NIR) photometry to search for substellar companions and debris disk candidates around white dwarfs. In the first work, the search was based on two spectroscopically identified white dwarf catalogues, while the second was based on a colour-selected white dwarf candidate sample built from the SDSS catalogue. They identified white dwarfs with IR excess emission by comparing the observed UKIDSS photometry with the expected white dwarf emission estimated from atmospheric models.
Steele et al. (2011) found 33 (Table 7 of their paper) and Girven et al. (2011) found 109 (Tables 5 and 6 of their paper) candidates for IR excess. Among them, there are only two at less than 100 pc, which are actually sources identified in both works. We confirmed the IR excess emission of both sources, as they were included in our reliable sample.
4.1.2 Candidates from Spitzer and AllWISE
The study by Dennihy et al. (2020) examined a sample of 22 white dwarfs previously reported to exhibit IR excesses based on the AllWISE survey. Using follow-up observations with Spitzer, they confirmed that eight of them had AllWISE contaminated photometry by an unresolved field source.
Seven of the objects in their initial sample lie within 100 pc. Of these, three were classified as genuine IR excesses, while the remaining four were identified as contaminated. All seven objects also appear in JE+23 and are included in our sample. Our classifications are fully consistent with theirs: the three objects with confirmed excesses are part of our reliable sample, whilst the other four show no indication of an excess in our analysis. One important difference between the two studies is the choice of WISE catalogues. We used CatWISE, whereas they used AllWISE. As explained in Sect. 5, CatWISE is a much better choice for white dwarfs.
4.1.3 Candidates from the WIRED survey
The WISE InfraRed Excesses around Degenerated (WIRED) survey was developed to detect IR excess around white dwarfs from WISE photometry. In a series of papers (Debes et al. 2011a,b; Hoard et al. 2013; Dennihy et al. 2017), the authors analysed samples of white dwarfs from the SDSS DR7 WD catalogue (Kleinman 2010), the McCook & Sion white dwarf catalogue (McCook & Sion 1999), and Edinburgh-Cape Blue Object Survey (Stobie et al. 1997), while also using the Preliminary, All-Sky, 3-Band Cryo, or AllWISE Data Release of WISE to identify IR excess candidates.
The WIRED authors identified a total of 1296 white dwarfs with IR excesses. Of them, 111 were within 100 pc, 90 were in JE+23, but six without classification and nine without enough IR photometry to be included in our analysed sample. Of the remaining 75 sources in common, 33 are in the reliable sample and 3 in the tentative sample, and we identified another 3 with contaminated photometry. The remaining 36 showed no excess.
The high percentage of sources for which we did not find IR excess is probably due to misidentification of their IR counterpart and to contaminated photometry, especially in WISE. They did not correct the white dwarf position for proper motion and used a larger search radius, which resulted in wrong identifications. In addition, they relied on earlier versions of the WISE catalogues that contained poorer photometry with many more blended sources, as explained above.
4.1.4 Candidates from Gaia DR2 and the VO
Rebassa-Mansergas et al. (2019) used the VO to search for IR excess white dwarfs within a 100 pc white dwarf sample built from the Gaia DR2 catalogue (Jiménez-Esteban et al. 2018), paving the way to the present work. Since no Gaia spectra were published in the DR2, they built the optical part of the object’s SED using photometric catalogues available at the VO and, similarly to this work, used
VOSAto fit the SEDs with DA models and identify the excesses.
Rebassa-Mansergas et al. (2019) identified 77 white dwarfs with IR excess (Tables 3 and 4 of that paper). Of them, 58 sources were also identified as having IR excess in this work: 55 in our reliable sample and 3 in the tentative sample. Of the remaining, ten showed no excess, eight were identified in the images inspection process as having contaminated photometry, and one did not have enough IR photometry for our analysis.
Additionally, Rebassa-Mansergas et al. (2019) presented a sample of 33 white dwarfs with tentative IR excess in their Table 5. Of them, we identified three with reliable and two with tentative IR excess. The remaining 27 showed either no excess (2), contaminated photometry (2), not enough IR photometric points (20), or were not in our initial sample (4).
These discrepancies are likely due to several improvements introduced in the present work:
Our studied sample comes from the 100 pc white dwarf sample by JE+23, which was built from Gaia DR3 instead of DR2, thereby increasing the number of white dwarfs, especially in the redder colours. Additionally, white dwarfs are now split between DAs and non-DAs using their Gaia spectra, which were not available before.
The optical part of the SEDs has greater and better coverage with the synthetic photometry of J-PAS, derived from Gaia DR3.
Nowadays, IR catalogues such as UKIDSS or VISTA have larger sky coverage, providing IR data for a greater number of white dwarfs than before. Additionally, we used Gaia DR3 proper motion to translate the source coordinates into the catalogue epoch, which permitted us to use a smaller search radius of 3″. Thus, we increased the number of identified IR counterparts, while reducing the number of misidentifications.
The MIR photometry data from CatWISE used in this work supersedes the AllWISE photometry data used in Rebassa-Mansergas et al. (2019), which greatly improved the quality of the MIR data (see Sect. 5).
We used DAs and non-DAs white dwarf atmospheric models to estimate with
VOSA
the expected emission of the source, which allowed for a more reliable IR excess identification. In fact, of the 180 non-DA white dwarfs with IR excess identified in this work, fewer than half (79) had been identified if the SEDs had been fitted with DA models. Thus, using non-DA models clearly increased the number of IR excess identifications.We extended the GBP − GRP colour range from 0.8 to 0.86, where the fraction of IR excess white dwarfs increases considerably (see Fig. 5).
All of these advantages enabled us to detect a greater number of reliable IR excesses. In addition, we were also able to rule out previous spurious identifications.
4.1.5 Candidates from Gaia DR2 and unwise
Xu et al. (2020) presented a sample of 188 IR excess candidates around bright white dwarfs obtained from Gaia DR2 and unWISE catalogues. In parallel, Lai et al. (2021) used Spitzer to search for IR excess around 174 white dwarfs (Tables B1 and B2 of that paper), with 56 of them in common with the Xu et al. (2020) sample. They confirmed 62 white dwarfs with IR excess, 44 of them in common with Xu et al. (2020) sample, but the remaining 18 objects were previously rejected by Xu et al. (2020).
Of the 174 initial candidates from Lai et al. (2021), 79 are closer than 100 pc. Of them, 69 were included in JE+23, but one was not spectrally classified and eight were discarded because they did not have sufficient IR photometry. Thus, there were 60 common objects between our initial sample and the initial sample of Lai et al. (2021). We agreed that 16 of them had reliable IR excess and 28 showed no excess; the remaining 16 were included in our IR sample (nine reliable and seven tentative), but were classified with no excess by Lai et al. (2021). This may be due to several factors. First, they applied a more restrictive condition to define a flux excess, where the difference between the observed and model flux had to differ at less 3.27 or 4.80 times the error module for Spitzer IRAC Ch1 (3.6 µm) and Ch2 (4.5 µm) bands, respectively. Second, their optical part might not have been well characterised due to the limited data of their SEDs and the use of only DA atmospheric models.
The Xu et al. (2020) sample comprised 188 objects: 72 at less than 100 pc, with 67 classified in JE+23, but 6 of those lacked sufficient IR photometry. Thus, we had 61 in common: we classified 42 with reliable excess, including the 10 objects mentioned above, and 2 with tentative excess; however, we found that 1 object presented contaminated photometry, while another 16 showed no IR excess. Moreover, of the sources that Xu et al. (2020) rejected as contaminated photometry, we identified 14 of them with either reliable (6) or tentative (8) IR excesses. Even more, we were able to identify another 48 sources with IR excesses (40 reliable and 8 tentative), which did not fulfil the criteria imposed by Xu et al. (2020) to be included in their IR excess candidate sample.
We mainly attribute the different results obtained to the use of improved data, with a better characterisation of the optical part of the white dwarf SED from the Gaia DR3 spectra, more reliable IR photometric data from CatWISE instead of unWISE catalogue, and a more exhaustive identification of the contaminated photometry.
4.1.6 Candidates from LAMOST and WISE
In Wang et al. (2023), a sample of white dwarfs with spectroscopic data in Large Sky Area Multi-Object Fiber Spectroscopic Telescope (LAMOST) DR5 and with distances in Gaia DR2 was analysed for IR excess in WISE (AllWISE and CatWISE). They identified 52 IR excess candidates (Tables 1, 2, and 3 of their paper); of these, only 2 white dwarfs are within 100 pc and both were included in our analysed sample. One showed a reliable IR excess, and the other showed no excess. The difference was due to our better SED coverage in the optical wavelength range.
4.1.7 Candidates from Gaia DR3 and CatWISE
Two recent works, by Madurga Favieres et al. (2024) and Bravo et al. (2025), based their search for IR excess in Gaia DR3 and CatWISE, as we also did. Therefore, one would expect similar results, although this was not the case.
Madurga Favieres et al. (2024) presented a candidate sample of 554 white dwarfs with IR excesses identified using Gaia Early Data Release 3 and CatWISE, 64 of which were within 100 pc. Of these, 62 were in the JE+23 catalogue; however, 2 were without spectral classification and 8 did not have enough IR photometry. The remaining 52 were studied in this work, with the following result: 40 showed reliable excess and 4 showed tentative IR excess, in two cases, the photometry was contaminated and the remaining 6 showed no excess. Additionally, many sources that we identified as showing IR excess (144 reliable and 74 tentative) were discarded by Madurga Favieres et al. (2024). These discrepancies arise because very restrictive conditions were imposed: the difference between the observed and model magnitudes (taking into account the errors) had to be greater than 8 or 30, depending on the apparent G magnitude of the object.
The second work mentioned above, Bravo et al. (2025), presented a candidate sample of 77 white dwarfs with IR excess (Tables 1 and 2 of their paper), identified as part of a search for ultracool companions to white dwarfs. In this case, the search was limited to a distance of 100 pc from the Sun.
Of the 77 identified excesses, 27 were already identified by Madurga Favieres et al. (2024). Of the remaining 50 objects, only 28 were in the JE+23 catalogue, but 4 had no spectral classification and 5 did not have sufficient IR photometry. Thus, we had 19 objects in common: 15 in the reliable sample, 1 in the tentative sample, 1 had contaminated photometry, and 2 showed no excess.
4.2 Spectroscopically confirmed IR excess
We reviewed the literature to identify whether any of our IR excess white dwarfs had been studied in detail to determine whether our results are consistent with previous spectroscopic works. In Table B.1 we present a bibliographical compilation of white dwarfs with spectroscopically confirmed excess emission in the solar neighbourhood (<100 pc). The table contains the Gaia DR3 identifier, the excess type classification in this work, the reference in which the excess was confirmed spectroscopically, the system type spectroscopically defined, and the telescope and instrument used in each case.
Recently, Limbach et al. (2024) and Farihi et al. (2025) confirmed the existence of some white dwarfs with IR excess with the James Webb Space Telescope (JWST), whereas we did not detect any. However, in these cases listed at the bottom of Table B.1, the IR excesses started at longer wavelengths than the available photometry used in this work.
In conclusion, we were able to identify the IR excess in the photometry of all the white dwarfs with IR excess confirmed spectroscopically, as long as there was photometry available at the wavelengths where the excess exists.
5 The fraction of IR excess white dwarfs
One important aspect to consider is the overall fraction of white dwarfs that exhibit IR excess. After cleaning the contaminated photometry (see Sect. 2.4), we searched for IR excess in a total sample of 4931 white dwarf SEDs with at least three good IR photometric points (λ > 12 000 Å; see Sect. 2). Of these, we identified 292 reliable and 164 tentative IR excesses. Thus, the estimated overall fraction of IR excess white dwarfs was 9.2 ± 0.4%, or 5.9 ± 0.3% when considering only reliable excesses.
As shown in Fig. 5, the largest rates of IR excess white dwarfs concentrate in the reddest colours. However, even if we excluded the reddest objects (GBP −GRP>0.66), the percentage of tentative and reliable IR excess and the percentage of only reliable excess sources are 8.3 ± 0.4% and 5.3 ± 0.4%, respectively; this is still higher than most of the values found in the literature (⪅4%) (e.g. Rebassa-Mansergas et al. 2019; Wilson et al. 2019; Rogers et al. 2020; Wang et al. 2023). Another consideration arises from the fact that all samples apart from that of Rebassa-Mansergas et al. (2019) were magnitude-limited, which directly affects their completeness, particularly at lower temperatures. It was worth noting that Xu et al. (2020) calculated a ratio of 6.6 ± 0.5%, which increased up to 8.4 ± 0.6% when taking into account completeness issues. Similarly, Madurga Favieres et al. (2024) obtained a fraction of ≈ 6%. These values are closer to those obtained in our study, based on the nearly complete volume-limited 100 pc sample of JE+23.
One of the main obstacles when estimating the percentage of IR excess white dwarfs is the assessment of the contamination by field sources, especially when the identification of the excess emission is based on WISE data. Dennihy et al. (2020) used Spitzer imaging to confirm the IR excess of a sample of AllWISE selected sources, finding ≈36% of contamination on a sample of 22 candidates (see Sect. 4.1.2). Lai et al. (2021) used Spitzer photometry to confirm the IR excess of a sample of 176 white dwarfs selected from unWISE photometry. In this case, the rate of contamination decreased to ≈20%. These better results could be explained by the improvement of the used WISE data. unWISE is based on significantly deeper imaging that combines five years of observations instead of just thirteen months as All-WISE. Furthermore, unWISE also improves the modelling of crowded regions (Schlafly et al. 2019).
We used CatWISE for our study, which improves upon unWISE by incorporating proper motions, by being based on eight years of observations and by being specifically optimised for identifying and resolving faint sources. All this makes Cat-WISE much more reliable than any other WISE catalogue, especially for faint and high proper motion sources like white dwarfs. Consequently, we would expect lower contamination than in the previous works.
We based the IR excess detection on all available IR photometry in the VO (see Sect. 2.2.2). In fact, for ≈25% of our sample, the IR excess was detected in other photometry bands besides WISE ones. Assuming a similar contamination rate than with unWISE, and taking into account that ≈75% of our sample, the excess is detected only on WISE data, our sample would be affected by ≈15% of contamination. However, as we explain above, CatWISE photometry is expected to be much less affected by background sources than the previously used WISE catalogues, so the expected contamination rate should be also much lower. Even more, we performed a very careful identification of contaminated photometry (Sect. 2.4), which resulted in the rejection of 218 candidates.
This is supported by the result of the comparison with the two above mentioned works in Sect. 4. There is a full agreement in the classification with Dennihy et al. (2020) for the seven sources in common (see Sect. 4.1.2). Furthermore, we have an agreement with the classification of Lai et al. (2021) for 44 of the 60 common objects (see Sect. 4.1.5). However, they applied a much restricted criterion to classify a source as with IR excess emission, which could have resulted in missing true IR excess sources. If they had applied the same criteria as we did, they would have included another three common sources in their IR excess sample. Taking these three sources and combining both works, the contamination would be ≈19% for our IR excess detections based on WISE data. However, as explained above, only 75% of the detections were only based on WISE data, so we can set a maximum limit of 15% for the overall contamination rate for our whole sample of IR excess white dwarfs. Furthermore, all the known white dwarfs with spectroscopic confirmation of IR excess emission are included in our IR excess sample.
For all the reasons discussed above, we conclude that the contamination rate in our IR excess white dwarf sample is low, with an upper limit of 15%.
6 Conclusions
We searched for sources with IR excess emission in the 100 pc sample of spectroscopically classified white dwarfs in JE+23. For this purpose, we used
VOSAto analyse their SEDs built from public spectroscopic and photometric archives. The optical part of the SEDs was populated with the synthetic J-PAS photometry obtained from Gaia DR3 low-resolution spectra, which provided a high coverage with 56 photometric points in the wavelength range between 4000 to 10 500 Å. The IR part of the SEDs was built from photometric catalogues available at the VO. To maximise the number of IR counterparts while minimising the number of misidentifications, we used Gaia proper motions to translate the white dwarf coordinates at the epoch of each IR survey and a small search radius of 3″. We imposed a minimum number of seven photometric points, four in the optical and three in the IR, in an SED to be further analysed with
VOSA, although ∼70% of the SEDs contained 59 or more photometric points. This restriction resulted in a sample of 5084 SEDs for the IR excess emission.
To identify the IR excess, we used
VOSAto fit the SEDs to white dwarf atmospheric models, using DA or non-DA models accordingly to the spectral classification of each source provided by JE+23. During the fitting process,
VOSAautomatically identified any photometric point affected by excess emission by comparing the observed brightness with the white dwarf brightness predicted from the best-fit model. To ensure the reliability of the IR excess emission found, we first imposed a minimum of two photometric points flagged as such by
VOSAand then we performed an exhaustive check of possible photometry contamination by inspecting both optical and IR images available at the VO. About one-third of the IR excesses were ruled out because of contaminated photometry.
As a result of this process, we have identified 456 white dwarfs exhibiting IR excess emission, comprising 292 reliable and 164 tentative. Among these, about 75% are new identifications. A catalogue containing these sources is accessible online at the CDS VizieR catalogue service10 and at The SVO archive of White Dwarfs from Gaia11.
We found IR excess emission in 5.9 ± 0.3% of the white dwarf SEDs analysed with
VOSAwhen only the reliable sample was taken into account, a value that increased to 9.2±0.4% when the complete IR excess sample was considered. This fraction is higher than that typically found in the literature. The use of highly populated SEDs, with 56 photometric points in the optical and the latest version of the IR catalogues, together with the use of different grids of atmospheric models for DAs and non-DAs sources, would explain the higher success of our methodology. Based on common sources among our study and other studies in the literature, we estimated an upper limit of 15% on the contamination rate; however, we actually expected a substantially lower level of contamination due to the use of the latest catalogue of WISE survey, CatWISE, in combination with other IR catalogues.
A first analysis of the data reveals that the fraction of non-DAs with IR excess relative to the total number of white dwarfs with IR excess increases with the Gaia GBP −GRP colour (Fig. 4), in contrast to the general population for which the fraction remains almost uniform for GBP −GRP > 0.2 mag. However, these results should be taken with caution given that non-DA atmospheric models are subject to larger uncertainties in the IR regime at low temperatures.
After comparing our results with previous photometric studies (Sect. 4.1), we found that 99 of the sources in our IR excess sample were already identified. Additionally, three objects in our list were previously reported in other photometric works not discussed in this work (Becklin & Zuckerman 1988; Farihi 2009; Farihi et al. 2010, 2012). We also identified 69 objects showing no excess and 12 with contaminated photometry that were incorrectly classified as exhibiting IR excess in at least one previous study. Furthermore, 26 of our objects have been confirmed spectroscopically (see Sect. 4.2); of these, 21 were in our IR excess sample, while the other 5 were not included because the excess emission becomes apparent only at wavelengths longer than the photometric coverage of our data.
The sample of nearby (<100 pc) white dwarfs with IR excess presented here is the most complete and reliable available to date. Although a spectroscopic confirmation is still required, our methodology, combined with careful treatment of contaminated photometry, makes this sample well suited for follow-up observations. A detailed characterisation of these systems will be presented in a forthcoming paper, offering new opportunities to investigate circumstellar disks, substellar companions, and the composition of accreted planetary material.
Data availability
The Gaia white dwarfs with IR excess catalogue is available at the CDS via https://cdsarc.cds.unistra.fr/viz-bin/cat/J/A+A/707/A268. It can also be queried via an online service available at the SVO website (see Appendix A). Table A.1 contains information about the catalogue columns.
Acknowledgements
We thank the anonymous referee for their valuable comments. RMO is funded by INTA through grant PRE-OBSERVATORIO. We acknowledge support from MINECO under the PID2023-148661NB-I00 grant and by the AGAUR/Generalitat de Catalunya grant SGR-386/2021. This work has made use of data from the European Space Agency (ESA) mission Gaia https://www.cosmos.esa.int/gaia), processed by the Gaia Data Processing and Analysis Consortium (DPAC, https://www.cosmos.esa.int/web/gaia/dpac/consortium). Funding for the DPAC has been provided by national institutions, in particular the institutions participating in the Gaia Multilateral Agreement. This work has made use of the Python package GaiaXPy, developed and maintained by members of the Gaia Data Processing and Analysis Consortium (DPAC), and in particular, Coordination Unit 5 (CU5), and the Data Processing Centre located at the Institute of Astronomy, Cambridge, UK (DPCI). This publication makes use of the
SVO Filter Profile Service “Carlos Rodrigo”and
VOSA, developed under the Spanish Virtual Observatory (https://svo.cab.inta-csic.es) project funded by MCIN/AEI/10.13039/501100011033/ through grant PID2023-146210NB-I00.
VOSAhas been partially updated by using funding from the European Union’s Horizon 2020 Research and Innovation Programme, under Grant Agreement nº 776403 (EXOPLANETS-A). This research has made use of “Aladin sky atlas” developed at CDS, Strasbourg Observatory, France. We extensively made used of Topcat (Taylor 2005). Based on data from the SVO archive of White Dwarfs from Gaia at CAB (CSIC-INTA). This publication makes use of data products from the Two Micron All Sky Survey, which is a joint project of the University of Massachusetts and the Infrared Processing and Analysis Center/California Institute of Technology, funded by the National Aeronautics and Space Administration and the National Science Foundation. This publication makes use of data products from UKIDSS and VISTA. The UKIDSS project is defined in Lawrence et al. (2007). UKIDSS uses the UKIRT Wide Field Camera (WFCAM; Casali et al. (2007)) and a photometric system described in Hewett et al. (2006). The pipeline processing and science archive are described in Irwin (2008) and Hambly et al. (2008). The VISTA Data Flow System pipeline processing and science archive are described in Irwin et al. (2004), Hambly et al. (2008) and Cross et al. (2012). This publication makes use of data products from the Wide-field Infrared Survey Explorer, which is a joint project of the University of California, Los Angeles, and the Jet Propulsion Laboratory/California Institute of Technology, funded by the National Aeronautics and Space Administration; and the Near-Earth Object Wide-field Infrared Survey Explorer (NEOWISE), which is a joint project of the Jet Propulsion Laboratory/California Institute of Technology and the University of Arizona. This work is based in part on observations made with the Spitzer Space Telescope, which was operated by the Jet Propulsion Laboratory, California Institute of Technology under a contract with NASA.
References
- Ahn, C. P., Alexandroff, R., Allende Prieto, C., et al. 2012, ApJS, 203, 21 [Google Scholar]
- Althaus, L. G., Córsico, A. H., Isern, J., & García-Berro, E. 2010, A&A Rev., 18, 471 [Google Scholar]
- Aungwerojwit, A., Gänsicke, B. T., Dhillon, V. S., et al. 2024, MNRAS, 530, 117 [NASA ADS] [CrossRef] [Google Scholar]
- Badenas-Agusti, M., Vanderburg, A., Blouin, S., et al. 2024, MNRAS, 527, 4515 [Google Scholar]
- Barber, S. D., Patterson, A. J., Kilic, M., et al. 2012, ApJ, 760, 26 [Google Scholar]
- Bayo, A., Rodrigo, C., y Navascués, D. B., et al. 2008, A&A, 492, 277 [NASA ADS] [CrossRef] [EDP Sciences] [Google Scholar]
- Becklin, E. E., & Zuckerman, B. 1988, Nature, 336, 656 [Google Scholar]
- Bédard, A. 2024, Ap & SS, 369, 43 [Google Scholar]
- Benitez, N., Dupke, R., Moles, M., et al. 2014, J-PAS: The Javalambre-Physics of the Accelerated Universe Astrophysical Survey [Google Scholar]
- Blouin, S., Kowalski, P. M., & Dufour, P. 2017, ApJ, 850, 181 [Google Scholar]
- Bonnarel, F., Fernique, P., Bienaymé, O., et al. 2000, A&AS, 143, 33 [Google Scholar]
- Bravo, A., Schneider, A. C., Casewell, S., et al. 2025, AJ, 169, 100 [Google Scholar]
- Brinkworth, C. S., Gänsicke, B. T., Girven, J. M., et al. 2012, ApJ, 750, 86 [Google Scholar]
- Brouwers, M. G., Bonsor, A., & Malamud, U. 2022, MNRAS, 509, 2404 [NASA ADS] [Google Scholar]
- Carrasco, J. M., Weiler, M., Jordi, C., et al. 2021, A&A, 652, A86 [NASA ADS] [CrossRef] [EDP Sciences] [Google Scholar]
- Casali, M., Adamson, A., Alves de Oliveira, C., et al. 2007, A&A, 467, 777 [NASA ADS] [CrossRef] [EDP Sciences] [Google Scholar]
- Casewell, S. L., Debes, J., Braker, I. P., et al. 2020, MNRAS, 499, 5318 [NASA ADS] [CrossRef] [Google Scholar]
- Casewell, S. L., Debes, J., Dupuy, T. J., et al. 2024, MNRAS, 530, 3302 [Google Scholar]
- Chambers, K. C., Magnier, E. A., Metcalfe, N., et al. 2016, arXiv e-prints [arXiv:1612.05560] [Google Scholar]
- Cross, N. J. G., Collins, R. S., Mann, R. G., et al. 2012, A&A, 548, A119 [NASA ADS] [CrossRef] [EDP Sciences] [Google Scholar]
- Cunningham, T., Tremblay, P.-E., Bauer, E. B., et al. 2021, MNRAS, 503, 1646 [NASA ADS] [CrossRef] [Google Scholar]
- Cunningham, T., Wheatley, P. J., Tremblay, P.-E., et al. 2022, Nature, 602, 219 [NASA ADS] [CrossRef] [Google Scholar]
- Debes, J. H., & Sigurdsson, S. 2002, ApJ, 572, 556 [NASA ADS] [CrossRef] [Google Scholar]
- Debes, J. H., Hoard, D. W., Kilic, M., et al. 2011a, ApJ, 729, 4 [NASA ADS] [CrossRef] [Google Scholar]
- Debes, J. H., Hoard, D. W., Wachter, S., Leisawitz, D. T., & Cohen, M. 2011b, ApJS, 197, 38 [NASA ADS] [CrossRef] [Google Scholar]
- Debes, J. H., Kilic, M., Faedi, F., et al. 2012a, ApJ, 754, 59 [NASA ADS] [CrossRef] [Google Scholar]
- Debes, J. H., Walsh, K. J., & Stark, C. 2012b, ApJ, 747, 148 [NASA ADS] [CrossRef] [Google Scholar]
- Debes, J. H., Thévenot, M., Kuchner, M. J., et al. 2019, ApJ, 872, L25 [NASA ADS] [CrossRef] [Google Scholar]
- Dennihy, E., Clemens, J. C., Debes, J. H., et al. 2017, ApJ, 849, 77 [NASA ADS] [CrossRef] [Google Scholar]
- Dennihy, E., Farihi, J., Gentile Fusillo, N. P., & Debes, J. H. 2020, ApJ, 891, 97 [CrossRef] [Google Scholar]
- Dey, A., Schlegel, D. J., Lang, D., et al. 2019, AJ, 157, 168 [Google Scholar]
- Dobbie, P. D., Burleigh, M. R., Levan, A. J., et al. 2005, MNRAS, 357, 1049 [Google Scholar]
- Egan, M. P., & Price, S. D. 1996, AJ, 112, 2862 [Google Scholar]
- Farihi, J. 2009, MNRAS, 398, 2091 Farihi, J. 2016, New A Rev., 71, 9 [Google Scholar]
- Farihi, J., & Christopher, M. 2004, AJ, 128, 1868 [Google Scholar]
- Farihi, J., Jura, M., Lee, J. E., & Zuckerman, B. 2010, ApJ, 714, 1386 [NASA ADS] [CrossRef] [Google Scholar]
- Farihi, J., Gänsicke, B. T., Steele, P. R., et al. 2012, MNRAS, 421, 1635 [NASA ADS] [CrossRef] [Google Scholar]
- Farihi, J., Gänsicke, B. T., & Koester, D. 2013, Science, 342, 218 [NASA ADS] [CrossRef] [Google Scholar]
- Farihi, J., Hermes, J. J., Marsh, T. R., et al. 2022, MNRAS, 511, 1647 [NASA ADS] [CrossRef] [Google Scholar]
- Farihi, J., Su, K. Y. L., Melis, C., et al. 2025, ApJ, 981, L5 [Google Scholar]
- Fontaine, G., Brassard, P., & Bergeron, P. 2001, PASP, 113, 409 [NASA ADS] [CrossRef] [Google Scholar]
- Gaia Collaboration (Montegriffo, P., et al.) 2023a, A&A, 674, A33 [CrossRef] [EDP Sciences] [Google Scholar]
- Gaia Collaboration (Vallenari, A., et al.) 2023b, A&A, 674, A1 [NASA ADS] [CrossRef] [EDP Sciences] [Google Scholar]
- Gänsicke, B. T., Marsh, T. R., Southworth, J., & Rebassa-Mansergas, A. 2006, Science, 314, 1908 [Google Scholar]
- García-Zamora, E. M., Torres, S., Rebassa-Mansergas, A., & Ferrer-Burjachs, A. 2025, A&A, 699, A3 [NASA ADS] [CrossRef] [EDP Sciences] [Google Scholar]
- Girven, J., Gänsicke, B. T., Steeghs, D., & Koester, D. 2011, MNRAS, 417, 1210 [Google Scholar]
- Girven, J., Brinkworth, C. S., Farihi, J., et al. 2012, ApJ, 749, 154 [NASA ADS] [CrossRef] [Google Scholar]
- Guidry, J. A., Vanderbosch, Z. P., Hermes, J. J., et al. 2021, ApJ, 912, 125 [NASA ADS] [CrossRef] [Google Scholar]
- Hambly, N. C., Collins, R. S., Cross, N. J. G., et al. 2008, MNRAS, 384, 637 [NASA ADS] [CrossRef] [Google Scholar]
- Harrison, J. H. D., Bonsor, A., Kama, M., et al. 2021, MNRAS, 504, 2853 [NASA ADS] [CrossRef] [Google Scholar]
- Hewett, P. C., Warren, S. J., Leggett, S. K., & Hodgkin, S. T. 2006, MNRAS, 367, 454 [Google Scholar]
- Hoard, D. W., Debes, J. H., Wachter, S., Leisawitz, D. T., & Cohen, M. 2013, ApJ, 770, 21 [NASA ADS] [CrossRef] [Google Scholar]
- Hollands, M. A., Gänsicke, B. T., & Koester, D. 2018, MNRAS, 477, 93 [NASA ADS] [CrossRef] [Google Scholar]
- Irwin, M. J. 2008, in 2007 ESO Instrument Calibration Workshop, eds. A. Kaufer, & F. Kerber, 541 [Google Scholar]
- Irwin, M. J., Lewis, J., Hodgkin, S., et al. 2004, SPIE Conf. Ser., 5493, 411 [Google Scholar]
- Isern, J., Torres, S., & Rebassa-Mansergas, A. 2022, Front. Astron. Space Sci., 9, 6 [NASA ADS] [CrossRef] [Google Scholar]
- Jiménez-Esteban, F. M., Torres, S., Rebassa-Mansergas, A., et al. 2018, MNRAS, 480, 4505 [Google Scholar]
- Jiménez-Esteban, F. M., Torres, S., Rebassa-Mansergas, A., et al. 2023, MNRAS, 518, 5106 [Google Scholar]
- Jura, M. 2003, ApJ, 584, L91 [Google Scholar]
- Jura, M., Farihi, J., Zuckerman, B., & Becklin, E. E. 2007, AJ, 133, 1927 [NASA ADS] [CrossRef] [Google Scholar]
- Jura, M., & Young, E. D. 2014, Annu. Rev. Earth Planet. Sci., 42, 45 [CrossRef] [Google Scholar]
- Kilic, M., & Redfield, S. 2007, ApJ, 660, 641 [NASA ADS] [CrossRef] [Google Scholar]
- Kilic, M., von Hippel, T., Leggett, S. K., & Winget, D. E. 2005, ApJ, 632, L115 [Google Scholar]
- Kilic, M., von Hippel, T., Leggett, S. K., & Winget, D. E. 2006, ApJ, 646, 474 [NASA ADS] [CrossRef] [Google Scholar]
- Kilic, M., Farihi, J., Nitta, A., & Leggett, S. K. 2008, AJ, 136, 111 [Google Scholar]
- Kilic, M., Patterson, A. J., Barber, S., Leggett, S. K., & Dufour, P. 2012, MNRAS, 419, L59 [Google Scholar]
- Kleinman, S. J. 2010, in American Institute of Physics Conference Series, 1273, 17th European White Dwarf Workshop, eds. K. Werner, & T. Rauch, 156 [Google Scholar]
- Koester, D. 2010, Mem. Soc. Astron. Italiana, 81, 921 [NASA ADS] [Google Scholar]
- Koester, D., & Kepler, S. O. 2019, A&A, 628, A102 [NASA ADS] [CrossRef] [EDP Sciences] [Google Scholar]
- Koester, D., Gänsicke, B. T., & Farihi, J. 2014, A&A, 566, A34 [NASA ADS] [CrossRef] [EDP Sciences] [Google Scholar]
- Kowalski, P. M. 2014, A&A, 566, L8 [NASA ADS] [CrossRef] [EDP Sciences] [Google Scholar]
- Lada, C. J., Muench, A. A., Luhman, K. L., et al. 2006, AJ, 131, 1574 [Google Scholar]
- Lai, S., Dennihy, E., Xu, S., et al. 2021, ApJ, 920, 156 [NASA ADS] [CrossRef] [Google Scholar]
- Lam, M. C., & Rowell, N. 2025, arXiv e-prints [arXiv:2503.14394] [Google Scholar]
- Lasker, B. M., Doggett, J., McLean, B., et al. 1996, in Astronomical Society of the Pacific Conference Series, 101, Astronomical Data Analysis Software and Systems V, eds. G. H. Jacoby, & J. Barnes, 88 [NASA ADS] [Google Scholar]
- Lawrence, A., Warren, S. J., Almaini, O., et al. 2007, MNRAS, 379, 1599 [Google Scholar]
- Li, D., Mustill, A. J., & Davies, M. B. 2021, MNRAS, 508, 5671 [NASA ADS] [CrossRef] [Google Scholar]
- Limbach, M. A., Vanderburg, A., Venner, A., et al. 2024, ApJ, 973, L11 [Google Scholar]
- Lindegren, L., Klioner, S. A., Hernández, J., et al. 2021, A&A, 649, A2 [EDP Sciences] [Google Scholar]
- Longstaff, E. S., Casewell, S. L., Wynn, G. A., et al. 2019, MNRAS, 484, 2566 [NASA ADS] [CrossRef] [Google Scholar]
- Madurga Favieres, C., Kissler-Patig, M., Xu, S., & Bonsor, A. 2024, A&A, 688, A168 [NASA ADS] [CrossRef] [EDP Sciences] [Google Scholar]
- Malamud, U., & Perets, H. B. 2020a, MNRAS, 493, 698 Malamud, U., & Perets, H. B. 2020b, MNRAS, 492, 5561 [Google Scholar]
- Malamud, U., Grishin, E., & Brouwers, M. 2021, MNRAS, 501, 3806 [NASA ADS] [Google Scholar]
- Manser, C. J., Gänsicke, B. T., Eggl, S., et al. 2019, Science, 364, 66 [Google Scholar]
- Manser, C. J., Izquierdo, P., Gänsicke, B. T., et al. 2024, MNRAS, 535, 254 [CrossRef] [Google Scholar]
- Marín-Franch, A., Chueca, S., Moles, M., et al. 2012, SPIE Conf. Ser., 8450, 84503S [Google Scholar]
- Marocco, F., Eisenhardt, P. R. M., Fowler, J. W., et al. 2021, ApJS, 253, 8 [Google Scholar]
- McCook, G. P., & Sion, E. M. 1999, ApJS, 121, 1 [Google Scholar]
- Melis, C., Farihi, J., Dufour, P., et al. 2011, ApJ, 732, 90 [NASA ADS] [CrossRef] [Google Scholar]
- Melis, C., Klein, B., Doyle, A. E., et al. 2020, ApJ, 905, 56 [NASA ADS] [CrossRef] [Google Scholar]
- Murakami, H., Baba, H., Barthel, P., et al. 2007, PASJ, 59, S369 [CrossRef] [Google Scholar]
- Mustill, A. J., Davies, M. B., & Kenworthy, M. A. 2024, MNRAS, 530, 3606 [Google Scholar]
- Neustroev, V. V., & Mäntynen, I. 2023, MNRAS, 523, 6114 [NASA ADS] [CrossRef] [Google Scholar]
- Olnon, F. M., Raimond, E., Neugebauer, G., et al. 1986, A&AS, 65, 607 [Google Scholar]
- Owens, D., Xu, S., Manjavacas, E., et al. 2023, AJ, 166, 5 [NASA ADS] [CrossRef] [Google Scholar]
- Raddi, R., Gänsicke, B. T., Koester, D., et al. 2015, MNRAS, 450, 2083 [NASA ADS] [CrossRef] [Google Scholar]
- Reach, W. T., Lisse, C., von Hippel, T., & Mullally, F. 2009, ApJ, 693, 697 [NASA ADS] [CrossRef] [Google Scholar]
- Rebassa-Mansergas, A., Liu, X. W., Cojocaru, R., et al. 2015, MNRAS, 450, 743 [NASA ADS] [CrossRef] [Google Scholar]
- Rebassa-Mansergas, A., Solano, E., Xu, S., et al. 2019, MNRAS, 489, 3990 [Google Scholar]
- Rebassa-Mansergas, A., Xu, S., Raddi, R., et al. 2022, ApJ, 927, L31 [Google Scholar]
- Rebassa-Mansergas, A., Maldonado, J., Raddi, R., et al. 2023, MNRAS, 526, 4787 [NASA ADS] [CrossRef] [Google Scholar]
- Riello, M., De Angeli, F., Evans, D. W., et al. 2021, A&A, 649, A3 [NASA ADS] [CrossRef] [EDP Sciences] [Google Scholar]
- Rocchetto, M., Farihi, J., Gänsicke, B. T., & Bergfors, C. 2015, MNRAS, 449, 574 [NASA ADS] [CrossRef] [Google Scholar]
- Rodrigo, C., Cruz, P., Aguilar, J. F., et al. 2024, A&A, 689, A93 [NASA ADS] [CrossRef] [EDP Sciences] [Google Scholar]
- Rogers, L. K., Xu, S., Bonsor, A., et al. 2020, MNRAS, 494, 2861 [Google Scholar]
- Rolland, B., Bergeron, P., & Fontaine, G. 2020, ApJ, 889, 87 [Google Scholar]
- Schlafly, E. F., Meisner, A. M., & Green, G. M. 2019, ApJS, 240, 30 [Google Scholar]
- Skrutskie, M. F., Cutri, R. M., Stiening, R., et al. 2006, AJ, 131, 1163 [NASA ADS] [CrossRef] [Google Scholar]
- Steele, P. R., Burleigh, M. R., Dobbie, P. D., et al. 2011, MNRAS, 416, 2768 [NASA ADS] [CrossRef] [Google Scholar]
- Steele, P. R., Saglia, R. P., Burleigh, M. R., et al. 2013, MNRAS, 429, 3492 [NASA ADS] [CrossRef] [Google Scholar]
- Stobie, R. S., Kilkenny, D., O’Donoghue, D., et al. 1997, MNRAS, 287, 848 [NASA ADS] [CrossRef] [Google Scholar]
- Swan, A., Farihi, J., Koester, D., et al. 2019, MNRAS, 490, 202 [NASA ADS] [CrossRef] [Google Scholar]
- Swan, A., Farihi, J., Su, K. Y. L., & Desch, S. J. 2024, MNRAS, 529, L41 [Google Scholar]
- Taylor, M. B. 2005, in Astronomical Society of the Pacific Conference Series, 347, Astronomical Data Analysis Software and Systems XIV, eds. P. Shopbell, M. Britton, & R. Ebert, 29 [NASA ADS] [Google Scholar]
- Tokunaga, A. T., Hodapp, K. W., Becklin, E. E., et al. 1988, ApJ, 332, L71 [Google Scholar]
- Torres, S., Rebassa-Mansergas, A., Camisassa, M. E., & Raddi, R. 2021, MNRAS, 502, 1753 [NASA ADS] [CrossRef] [Google Scholar]
- Torres, S., Cruz, P., Murillo-Ojeda, R., et al. 2023, A&A, 677, A159 [NASA ADS] [CrossRef] [EDP Sciences] [Google Scholar]
- Unda-Sanzana, E., Marsh, T. R., Gänsicke, B. T., et al. 2008, MNRAS, 388, 889 [NASA ADS] [CrossRef] [Google Scholar]
- Vanderburg, A., Johnson, J. A., Rappaport, S., et al. 2015, Nature, 526, 546 [Google Scholar]
- Veras, D., & Heng, K. 2020, MNRAS, 496, 2292 [Google Scholar]
- Veras, D., Leinhardt, Z. M., Bonsor, A., & Gänsicke, B. T. 2014, MNRAS, 445, 2244 [NASA ADS] [CrossRef] [Google Scholar]
- Veras, D., Leinhardt, Z. M., Eggl, S., & Gänsicke, B. T. 2015, MNRAS, 451, 3453 [NASA ADS] [CrossRef] [Google Scholar]
- Veras, D., Mustill, A. J., & Bonsor, A. 2024, Rev. Mineral. Geochem., 90, 141 [Google Scholar]
- Wang, L., Zhang, X., Wang, J., et al. 2023, ApJ, 944, 23 [NASA ADS] [CrossRef] [Google Scholar]
- Werner, M. W., Roellig, T. L., Low, F. J., et al. 2004, ApJS, 154, 1 [NASA ADS] [CrossRef] [Google Scholar]
- Wilson, T. G., Farihi, J., Gänsicke, B. T., & Swan, A. 2019, MNRAS, 487, 133 [CrossRef] [Google Scholar]
- Wright, E. L., Eisenhardt, P. R. M., Mainzer, A. K., et al. 2010, AJ, 140, 1868 [Google Scholar]
- Xu, S., Zuckerman, B., Dufour, P., et al. 2017, ApJ, 836, L7 [Google Scholar]
- Xu, S., Lai, S., & Dennihy, E. 2020, ApJ, 902, 127 [NASA ADS] [CrossRef] [Google Scholar]
- Zuckerman, B., Koester, D., Reid, I. N., & Hünsch, M. 2003, ApJ, 596, 477 [Google Scholar]
- Zuckerman, B., Melis, C., Klein, B., Koester, D., & Jura, M. 2010, ApJ, 722, 725 [Google Scholar]
Note: ≲0.5% of white dwarfs with IR excess are attributed to the presence of a brown dwarf companion.
The VO (https://www.ivoa.net/about/what-is-vo.html) is an initiative of the International Virtual Observatory Alliance (IVOA: https://www.ivoa.net/). It was created to optimise the mining of astronomical data. The VO provides services and tools that follow the FAIR principles: findable, accessible, interoperable, and reusable.
Appendix A Online catalogue service
In order to help the astronomical community on using our catalogue of white dwarfs, we developed a web archive system that can be accessed from a webpage12 or through a VO ConeSearch.13
The archive system implements a very simple search interface that permits queries by coordinates and radius as well as by other parameters of interest. The user can also select the maximum number of sources (with values from 10 to unlimited) and the number of columns to return (minimum, default, or maximum verbosity).
The result of the query is a HTML table with all the sources found in the archive fulfilling the search criteria. The result can also be downloaded as a VOTable or a CSV file. Detailed information on the output fields can be obtained placing the mouse over the question mark (‘?’) located close to the name of the column. The archive also implements the Simple Application Messaging Protocol14 (SAMP) VO protocol. SAMP allows VO applications to communicate with each other in a seamless and transparent manner for the user. This way, the results of a query can be easily transferred to other VO applications, such as, e.g.
TOPCAT.
Description of the columns in the catalogue of white dwarfs with reliable and tentative IR excess.
Appendix B Spectroscopically confirmed IR excess table
Spectroscopically confirmed IR excess.
All Tables
Description of the columns in the catalogue of white dwarfs with reliable and tentative IR excess.
All Figures
|
Fig. 1 SEDs of two white dwarfs (Gaia DR3 1900545847646195840 and Gaia DR3 5187830356195791488) showing IR excess emission. The left-hand panel shows an example of a DA model fit, and the right-hand panel an example of a non-DA model fit. Models are shown with blue lines and the photometric data with black or red points depending on whether excess flux emission with respect to the model is detected or not, respectively. |
| In the text | |
|
Fig. 2 Example of a white dwarf SED with contaminated photometry, Gaia DR3 5793469226531573376. Left panel: SED with the photometric data shown with different colours and symbols: J-PAS with green points, 2MASS with orange diamonds, VISTA with blue ovals, and WISE with red squares. The grey line corresponds to the non-DA model that best fits the photometric data. Middle and right panels: DESI (optical) and 2MASS (NIR) images, respectively, centred at the Gaia DR3 position of the white dwarf at epoch J2000 (magenta cross) and showing the white dwarf and a nearby field star at the southeast. Gaia DR3 counterparts at epochs J2000 and J2015.4 are shown with green solid and empty circles, respectively. Gaia DR3 proper motion directions are shown with green lines. The line running from south to north is for the white dwarf, while the line running from northeast to southwest is for the nearby field star. The 2MASS counterpart is shown as an orange diamond, the WISE counterpart is shown as a red square, and the VISTA counterparts are shown as blue ovals. |
| In the text | |
|
Fig. 3 Gaia HRDs for the DAs (left panel) and non-DAs (right panel) with reliable and tentative IR excess detections. For comparison, we show the 100 pc white dwarf DAs (left panel) and non-DAs (right panel) population from JE+23. |
| In the text | |
|
Fig. 4 Distribution of the fraction of non-DAs with IR excess relative to the total number of white dwarfs with IR excess as a function of the Gaia colour. The reliable sample is shown in the left panel, and the total IR excess sample in the right panel. For comparison, the same ratio for the general population of white dwarfs at 100 pc is shown in grey. |
| In the text | |
|
Fig. 5 Distribution of the fraction of white dwarfs with IR excess with respect to the number of white dwarfs with enough IR photometry data in function of the Gaia colour. |
| In the text | |
Current usage metrics show cumulative count of Article Views (full-text article views including HTML views, PDF and ePub downloads, according to the available data) and Abstracts Views on Vision4Press platform.
Data correspond to usage on the plateform after 2015. The current usage metrics is available 48-96 hours after online publication and is updated daily on week days.
Initial download of the metrics may take a while.