Fig. 4
Download original image
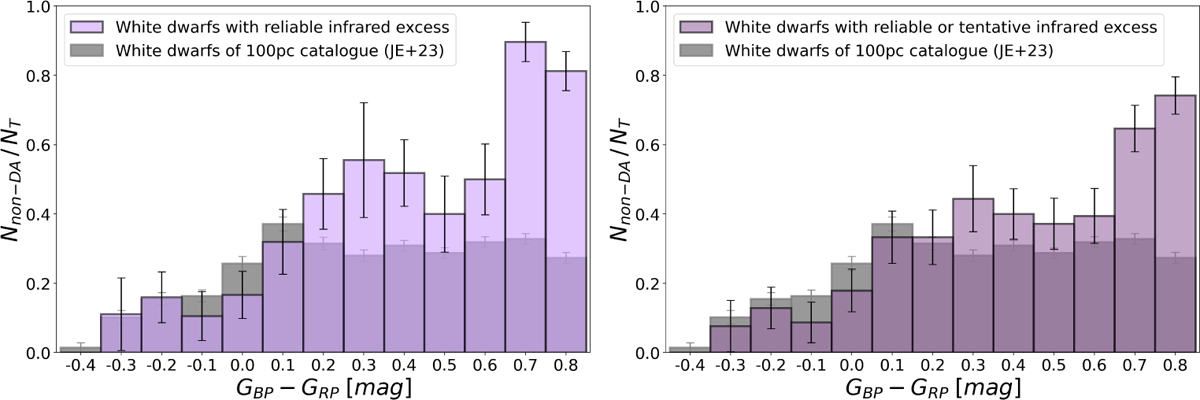
Distribution of the fraction of non-DAs with IR excess relative to the total number of white dwarfs with IR excess as a function of the Gaia colour. The reliable sample is shown in the left panel, and the total IR excess sample in the right panel. For comparison, the same ratio for the general population of white dwarfs at 100 pc is shown in grey.
Current usage metrics show cumulative count of Article Views (full-text article views including HTML views, PDF and ePub downloads, according to the available data) and Abstracts Views on Vision4Press platform.
Data correspond to usage on the plateform after 2015. The current usage metrics is available 48-96 hours after online publication and is updated daily on week days.
Initial download of the metrics may take a while.