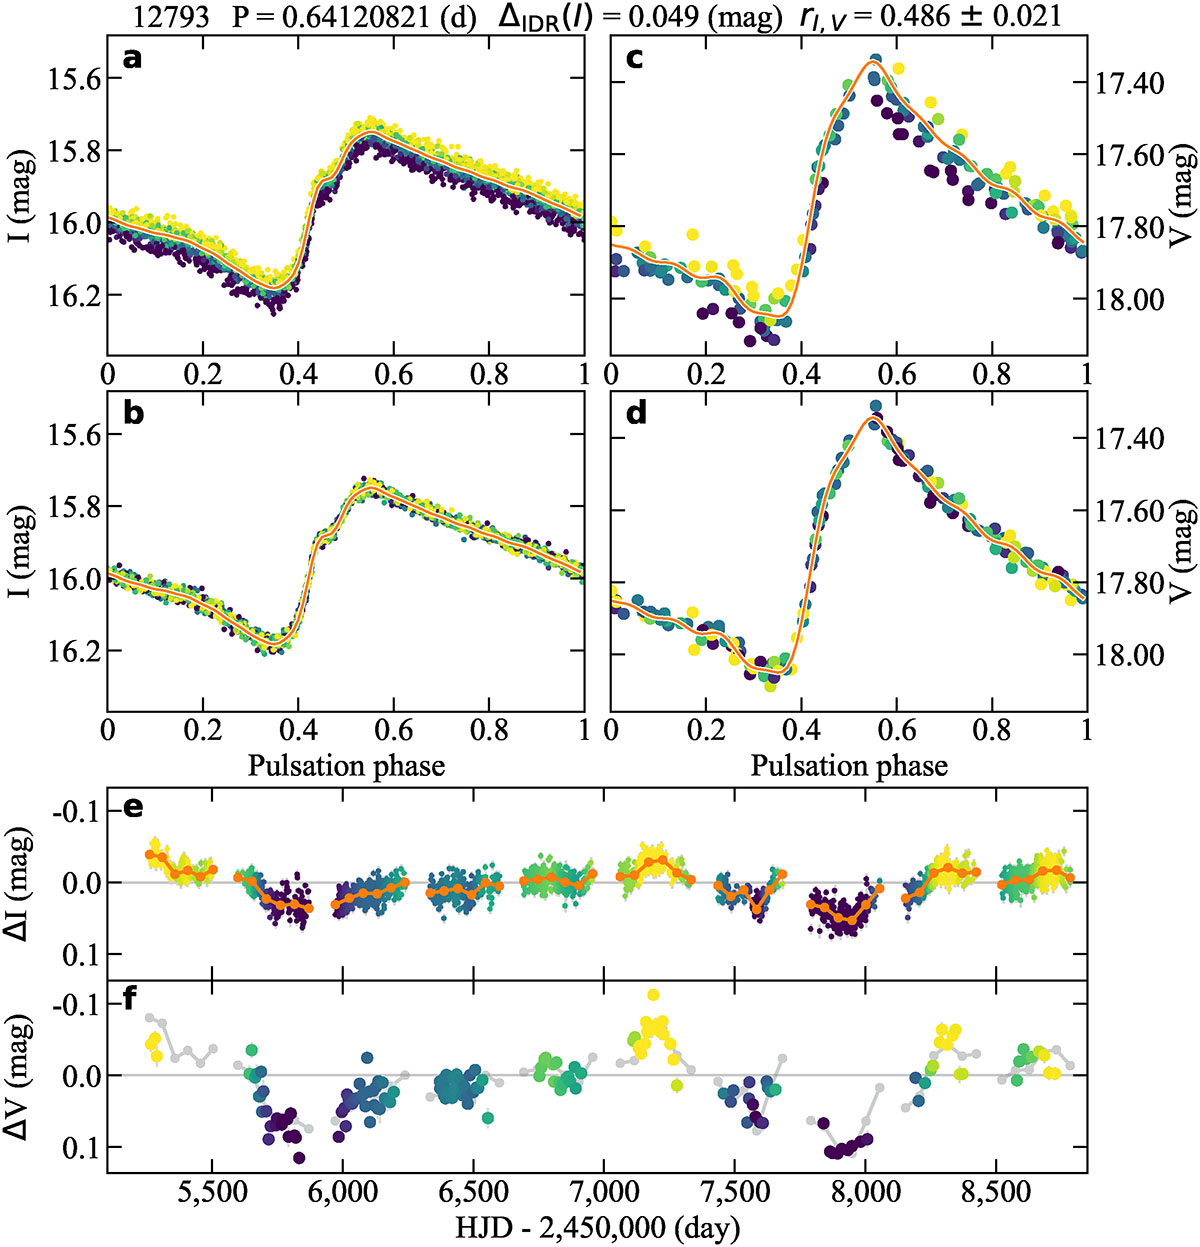
Fig. 1.
Download original image
Summary plot for one of the analyzed stars. Panel a: original OGLE I-band light curve folded with the period of pulsation, with the corresponding Fourier fit overlaid. Panel b: same as (a), but with the long-term changes removed. Panel c: same as (a), but for the V-band data. Panel d: same as (b), but for the V-band data. Panel e: I-band data after subtraction of the Fourier light-curve model. The orange dots and lines show the fit of the long-term changes in brightness. Panel f: same as (e), but for the V-band light curve. All light-curve points are colored according to the estimated mean-magnitude values during the observations, with lighter and darker points corresponding to brighter and fainter epochs, respectively. Above the panels, the OGLE ID, pulsation period, amplitude (ΔIDR(I)), and amplitude ratio (rI, V = A(I)/A(V)) of the mean-magnitude changes are given. The complete set of summary plots is available as online material. (see Data availability paragraph).
Current usage metrics show cumulative count of Article Views (full-text article views including HTML views, PDF and ePub downloads, according to the available data) and Abstracts Views on Vision4Press platform.
Data correspond to usage on the plateform after 2015. The current usage metrics is available 48-96 hours after online publication and is updated daily on week days.
Initial download of the metrics may take a while.