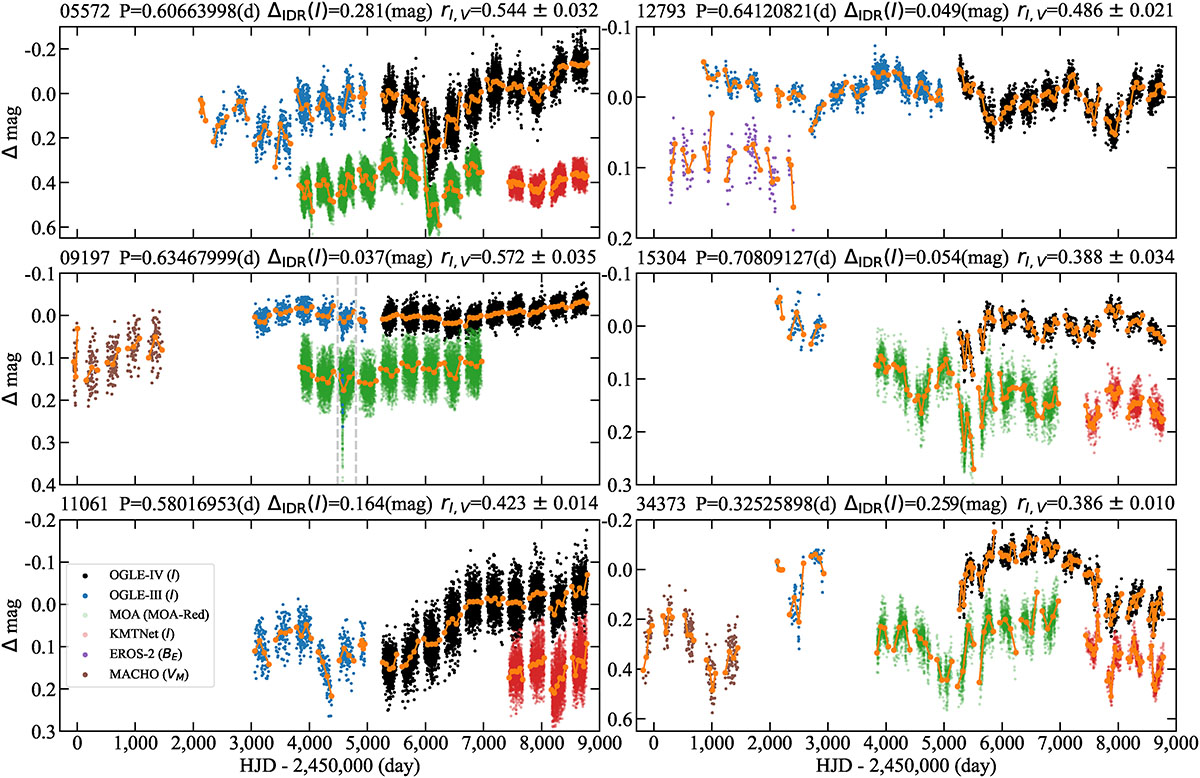
Fig. 2.
Download original image
Comparison of RRL mean-magnitude changes between different surveys. Each panel shows the OGLE-IV, OGLE-III, MACHO, EROS-2, MOA, and KMTNet light curves (black, blue, brown, purple, green, and red dots, respectively; see their descriptions in Appendix A) after subtraction of (separate) Fourier light-curve models for each dataset. Light curves are offset by arbitrary amounts for clarity. The overlaid orange dots and lines show the mean-magnitude change modeling according to the light-curve fits, similarly to panel (e) of Fig. 1. Above the panels, the OGLE ID, the pulsation period, the amplitude of the mean-magnitude changes, and the measured amplitude ratio rI, V = A(I)/A(V) are given for the corresponding RRL, based on the OGLE-IV data.
Current usage metrics show cumulative count of Article Views (full-text article views including HTML views, PDF and ePub downloads, according to the available data) and Abstracts Views on Vision4Press platform.
Data correspond to usage on the plateform after 2015. The current usage metrics is available 48-96 hours after online publication and is updated daily on week days.
Initial download of the metrics may take a while.