Fig. 3.
Download original image
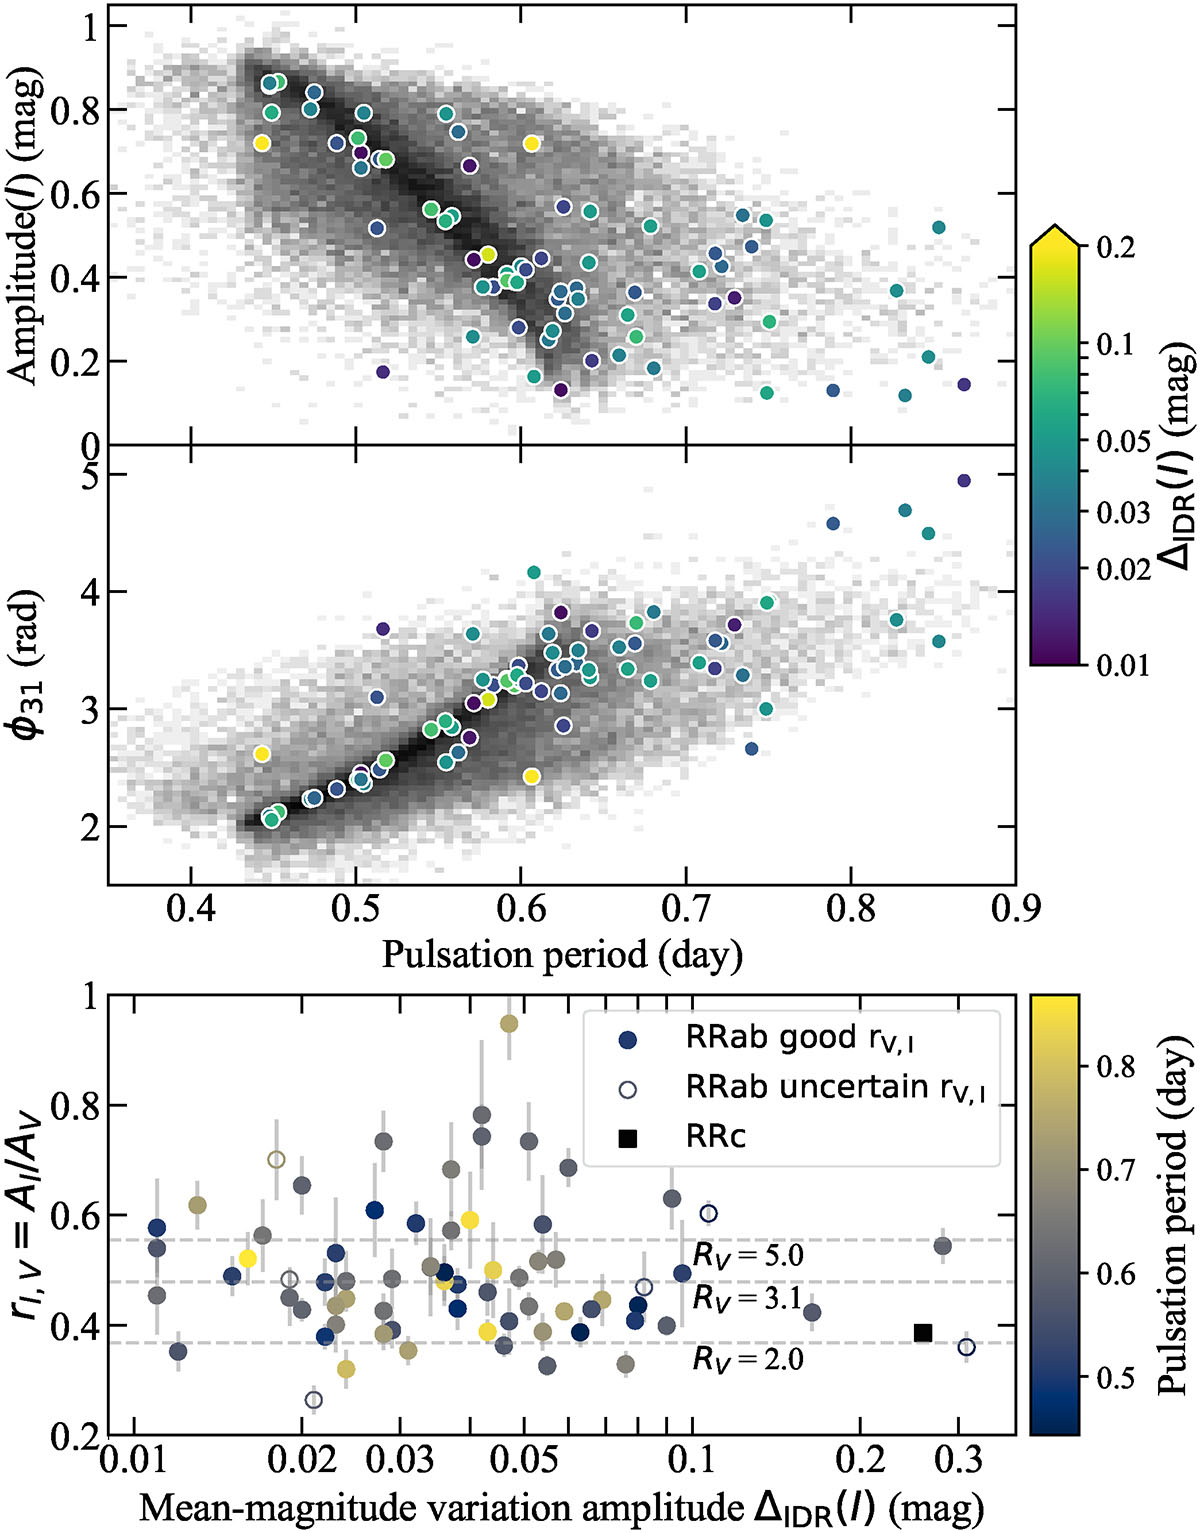
Top panel: period–amplitude (Bailey) diagram of the OGLE bulge RRab sample (gray 2D histogram, shown on a logarithmic scale) and the mean-magnitude-changing RRL variables with circles colored according to the measured I-band mean-magnitude changes. Middle panel: distribution of epoch-independent phase differences (ϕ31) of the RRab stars. Bottom panel: dependency of the amplitude ratio rI, V on the amplitude of the I-band mean-magnitude changes. RRab stars are marked with circles and are colored according to their pulsation periods, while the single RRc star is marked with a black square. The horizontal dashed lines indicate the expected extinction ratios for different RV values of the standard interstellar extinction law (Cardelli et al. 1989).
Current usage metrics show cumulative count of Article Views (full-text article views including HTML views, PDF and ePub downloads, according to the available data) and Abstracts Views on Vision4Press platform.
Data correspond to usage on the plateform after 2015. The current usage metrics is available 48-96 hours after online publication and is updated daily on week days.
Initial download of the metrics may take a while.