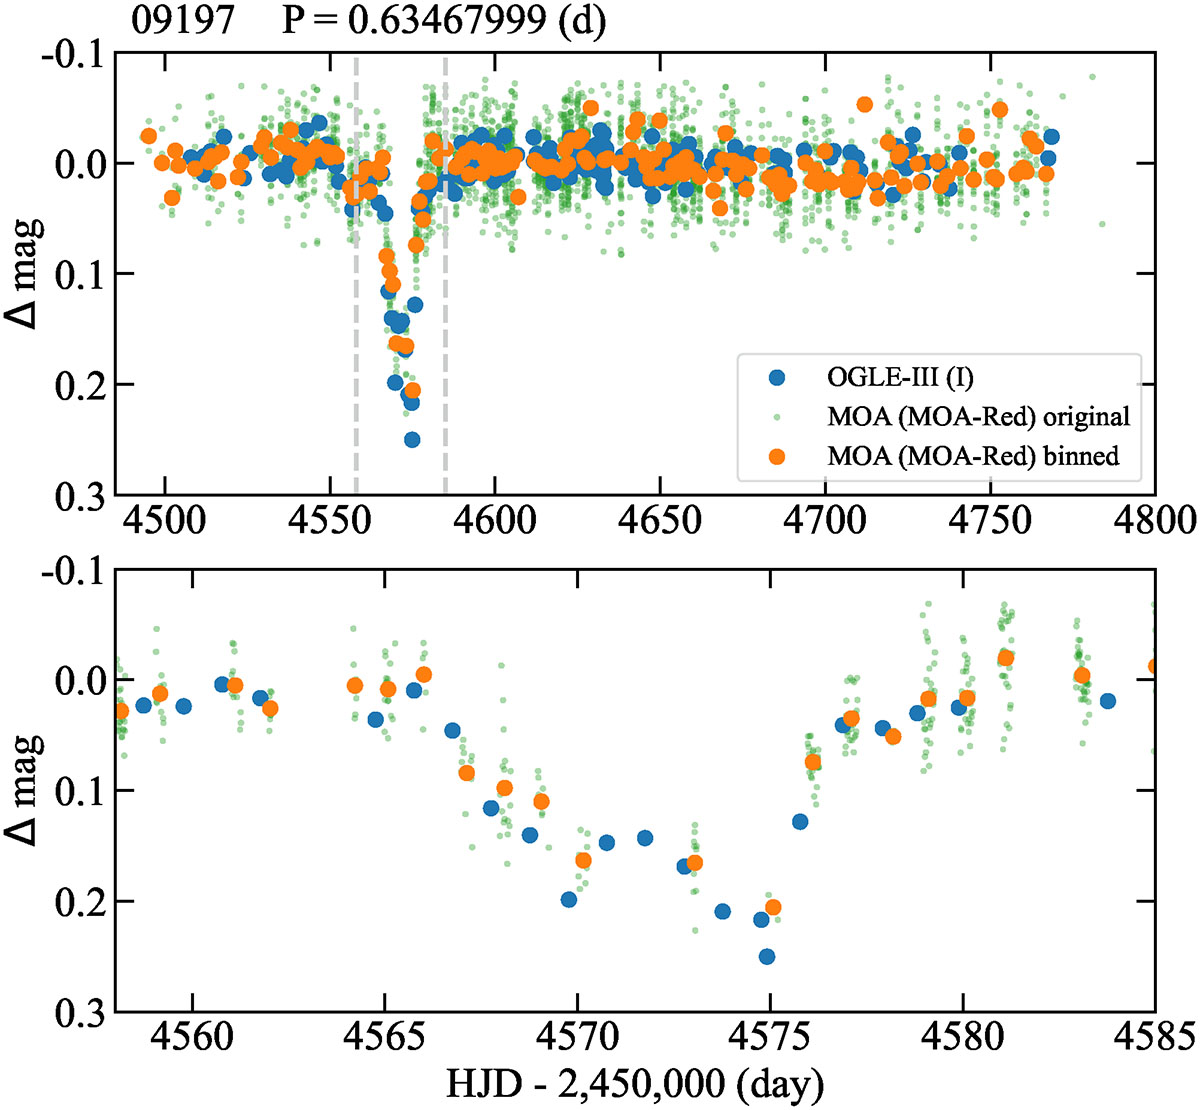
Fig. 4.
Download original image
Eclipse-like event of OGLE-BLG-RRLYR-09197. Top: residual light curve of the 2008 observational season. Both pulsation and long-term mean-magnitude changes are subtracted. OGLE and MOA observations are shown with blue and green dots, respectively. For clarity, daily average magnitudes for the MOA data are also shown with orange points. Bottom: same as the top panel, but showing the event between the limits marked by vertical dashed gray lines.
Current usage metrics show cumulative count of Article Views (full-text article views including HTML views, PDF and ePub downloads, according to the available data) and Abstracts Views on Vision4Press platform.
Data correspond to usage on the plateform after 2015. The current usage metrics is available 48-96 hours after online publication and is updated daily on week days.
Initial download of the metrics may take a while.