Open Access
Fig. 5.
Download original image
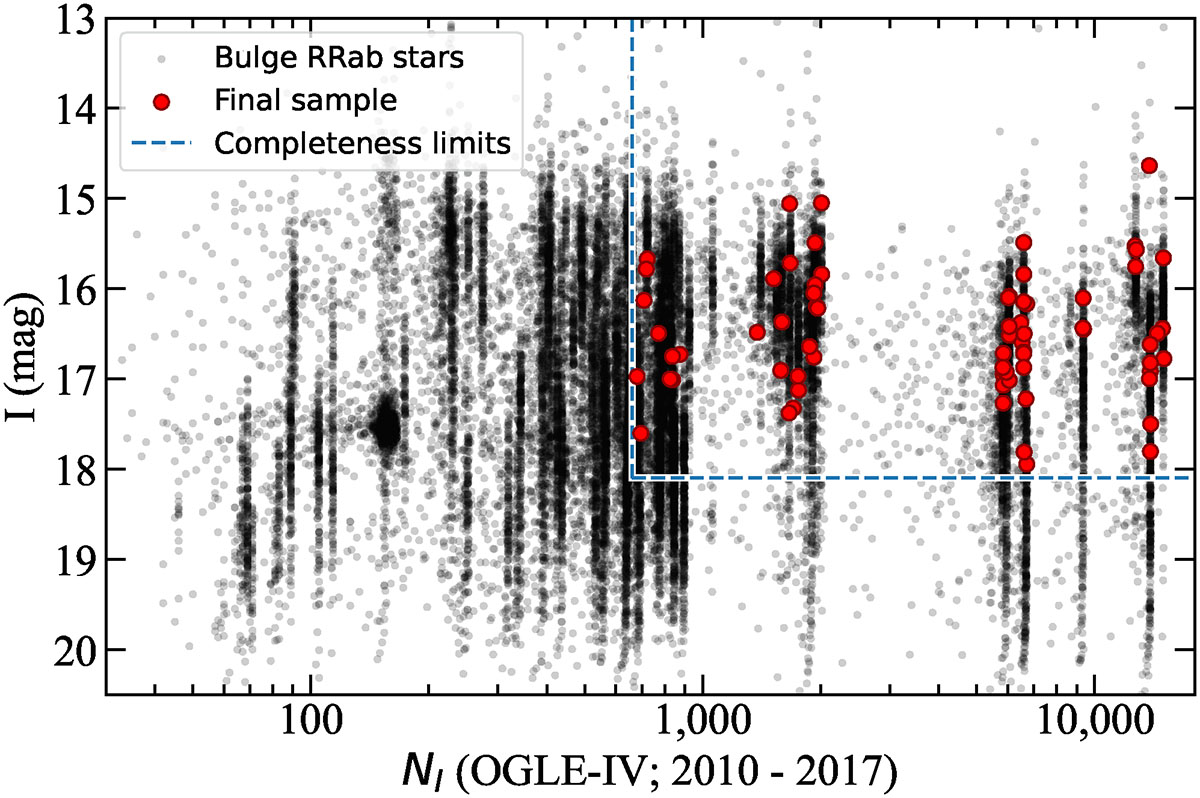
Distribution of the available I-band data points and mean magnitudes in the OGLE survey for RRab stars (black points). The stars in our final sample are marked with red circles. The dashed blue lines denote the region used to calculate the incidence rate of the mean-magnitude changing effect in RRab stars.
Current usage metrics show cumulative count of Article Views (full-text article views including HTML views, PDF and ePub downloads, according to the available data) and Abstracts Views on Vision4Press platform.
Data correspond to usage on the plateform after 2015. The current usage metrics is available 48-96 hours after online publication and is updated daily on week days.
Initial download of the metrics may take a while.