Fig. 6.
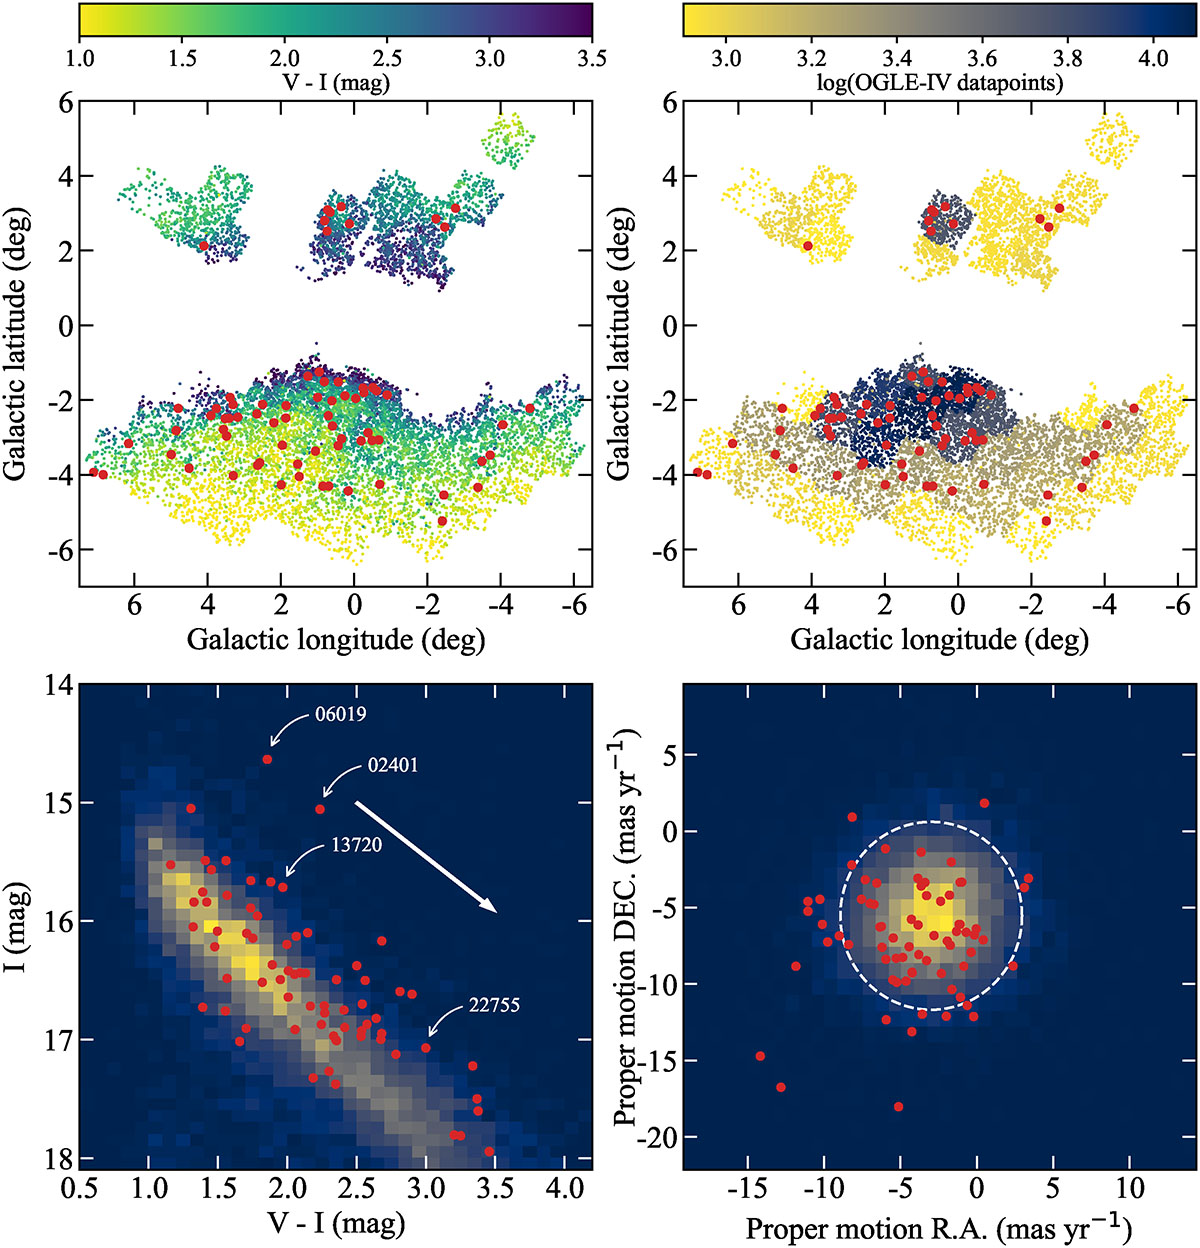
Download original image
Properties of the 71 RRab stars in our sample (red dots) vs. stars used for incidence rate calculation (see Figure 5). Top left: distribution of RRab stars in Galactic coordinates. Colors correspond to the V − I color of each RRab star. Top right: same as top left, but with the colors corresponding to the number of available I-band data points. Bottom left: I vs. V − I color-magnitude diagram of the RRab stars. The white arrow denotes the reddening vector for 1 magnitude of color excess for RV = 3.1 (Cardelli et al. 1989). Bottom right: proper motion distribution of the sample. The dashed white ellipse denotes the two standard deviation distances from the sample median.
Current usage metrics show cumulative count of Article Views (full-text article views including HTML views, PDF and ePub downloads, according to the available data) and Abstracts Views on Vision4Press platform.
Data correspond to usage on the plateform after 2015. The current usage metrics is available 48-96 hours after online publication and is updated daily on week days.
Initial download of the metrics may take a while.