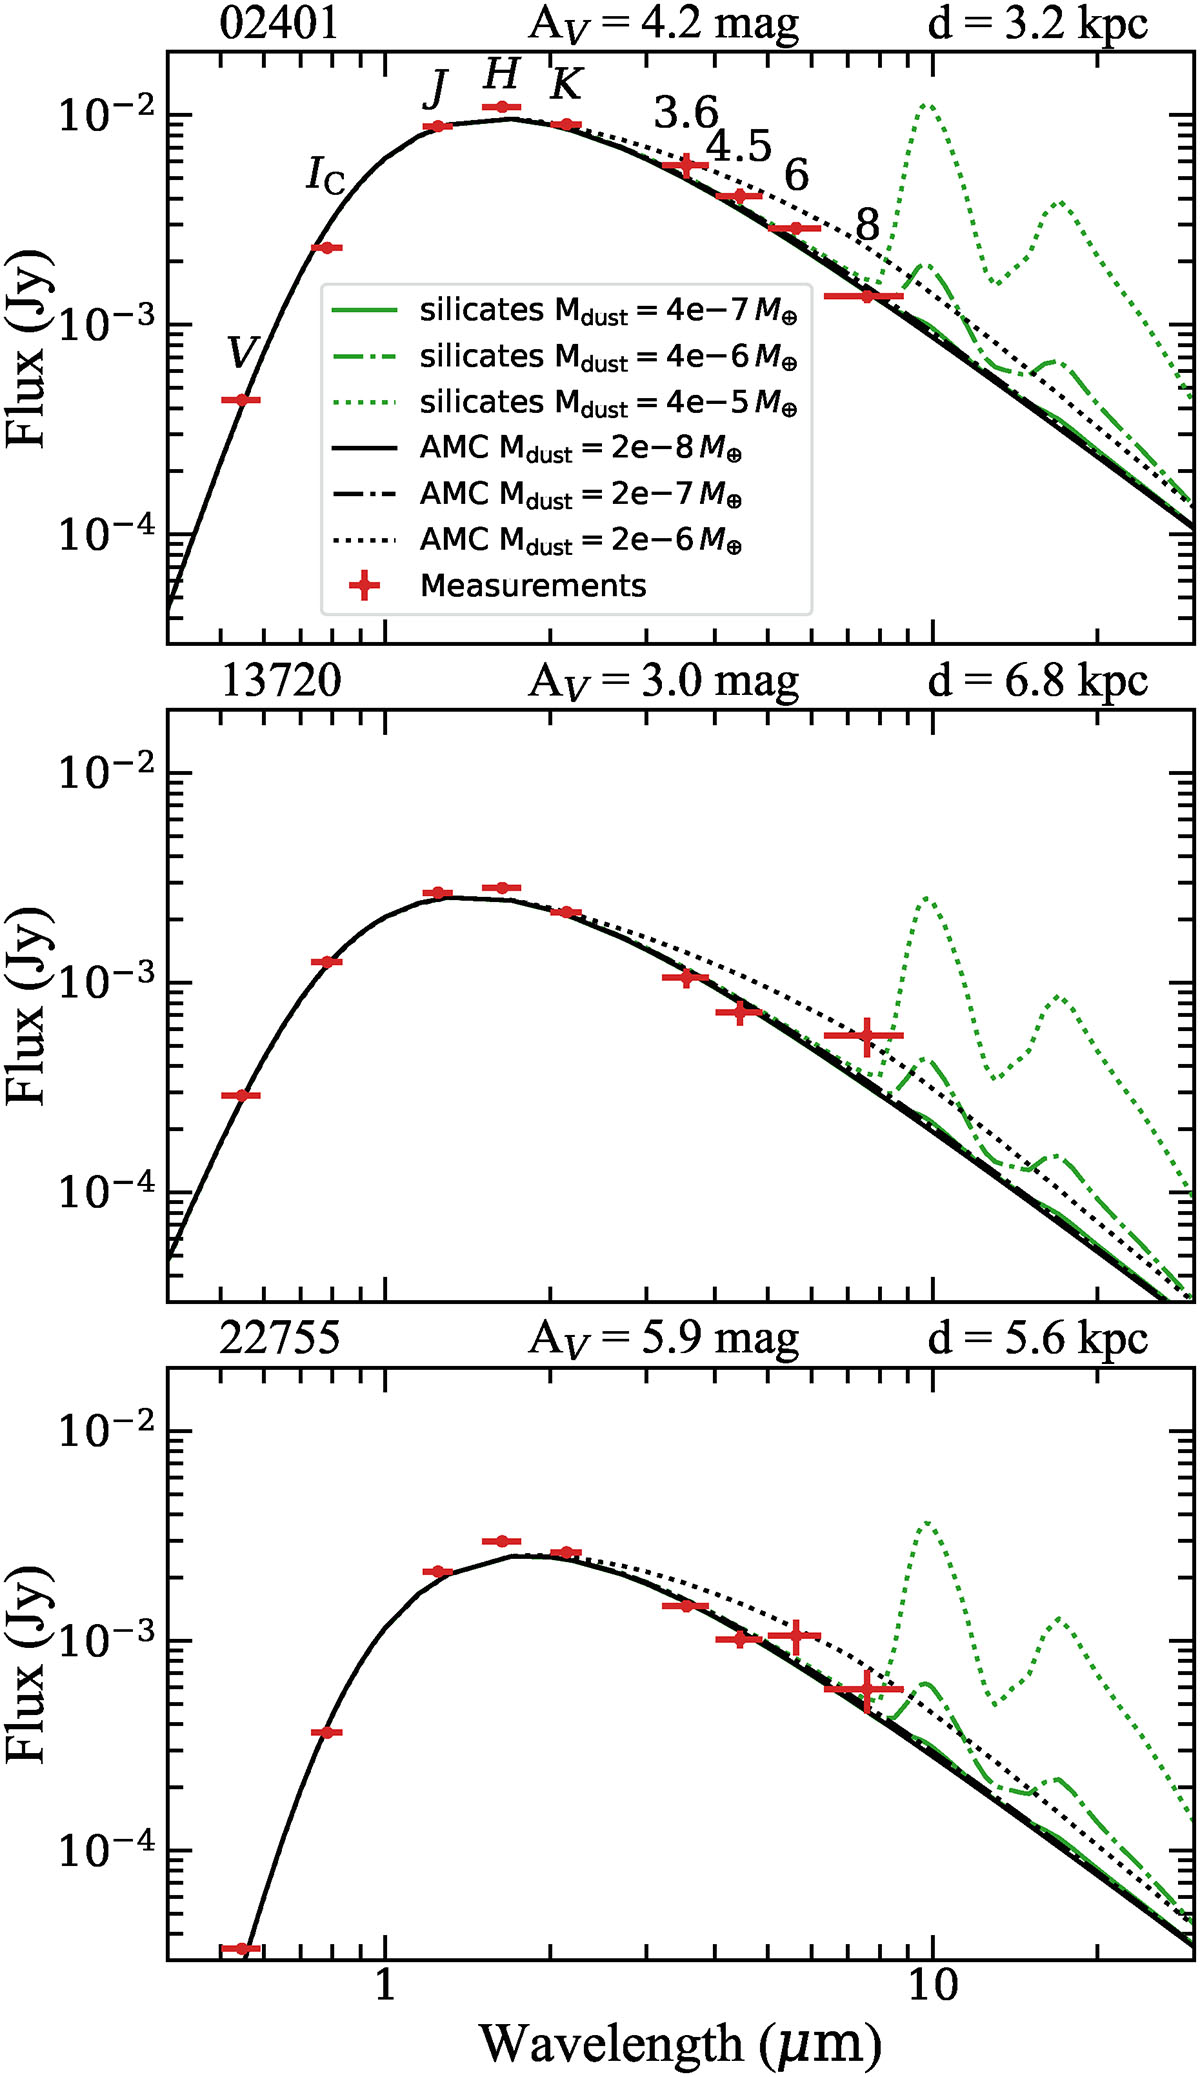
Fig. 7.
Download original image
Spectral energy distributions of RRL with 8 μm photometry available. On each panel, the measured fluxes of a star are marked with red dots. The vertical and horizontal bars mark the measurement uncertainties and the effective widths of the photometric bands, respectively. The black and green curves correspond to DUSTY models with circumstellar envelopes made of amorphous carbon and silicate dust, respectively. The solid, dash-dotted, and dotted lines show progressively higher amounts of dust. Above each panel, the OGLE ID, the adopted values of V-band extinction, and distance are given. The locations of these three stars are marked by arrows on the color-magnitude diagram of the final sample (bottom-left panel of Fig. 2).
Current usage metrics show cumulative count of Article Views (full-text article views including HTML views, PDF and ePub downloads, according to the available data) and Abstracts Views on Vision4Press platform.
Data correspond to usage on the plateform after 2015. The current usage metrics is available 48-96 hours after online publication and is updated daily on week days.
Initial download of the metrics may take a while.